by Robin Dost
Part 5 of 7 of building the Malwarebox Ecosystem
URL: https://feed.iim.malwarebox.eu
Malwarebox: https://malwarebox.eu
IIM: https://iim.malwarebox.eu
IIM Spec: https://github.com/MalwareboxEU/IIM
I have been working on IIM for a while now, mostly because adversary infrastructure is still weirdly underrepresented in public CTI.
If you track adversaries, you’re probably familiar with the challenge of reconstructing their attacks:
- We have IOC feeds.
- We have malware databases.
- We have ATT&CK mappings.
- We have long reports with screenshots, diagrams and tables.
All useful.
And still, when you want to understand how an operation was actually built, you often end up doing the same thing manually again:
Open the report -> Extract the domains -> Follow the URLs -> Check the samples -> Look at the redirect chain -> Find the staging host -> Check what the payload talks to -> Write notes -> Draw a mental grap -> Maybe put it into some internal tool -> Then forget where half of the context came from three weeks later
Very efficient. Very 2026.
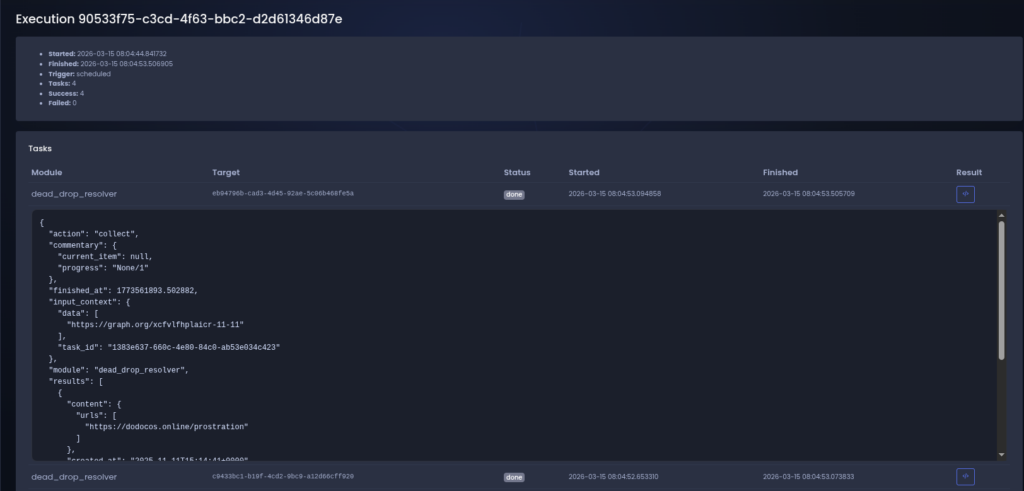
So I built a public viewer for IIM chains:
https://feed.iim.malwarebox.eu
The goal is simple:
Make adversary infrastructure chains visible, browsable and reusable 🙂
What the feed website is
The IIM Public Feed website is a public interface for structured IIM chains.
[LIVE VIEW]
Instead of only publishing isolated indicators, the feed shows how observed infrastructure components are connected inside an operation.
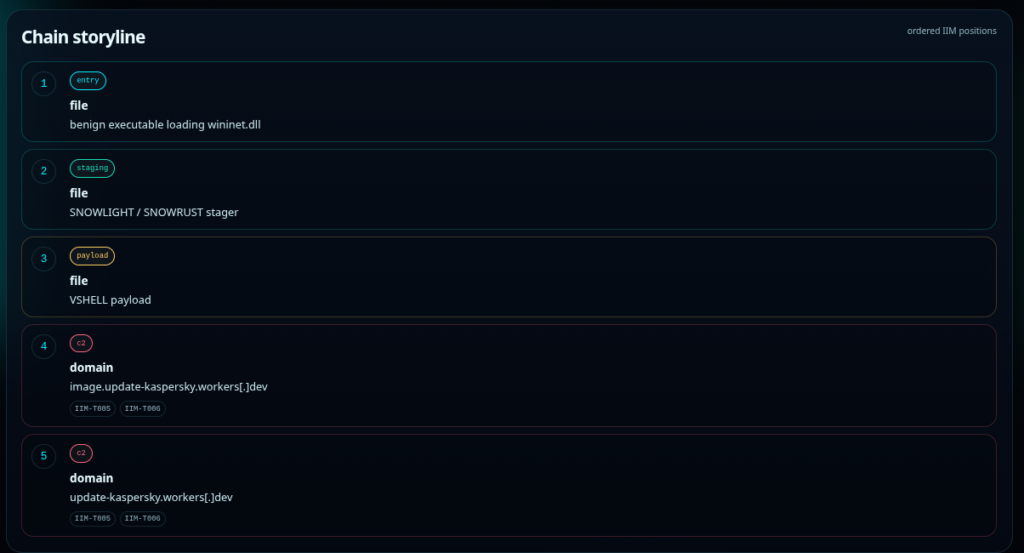
A chain can include things like:
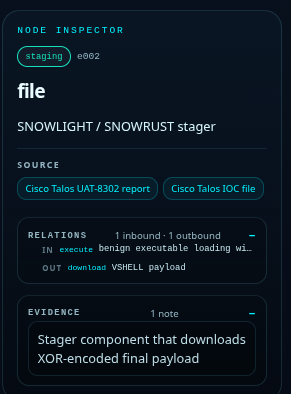
entry -> redirector -> staging -> payload -> c2Or, in a more practical example:
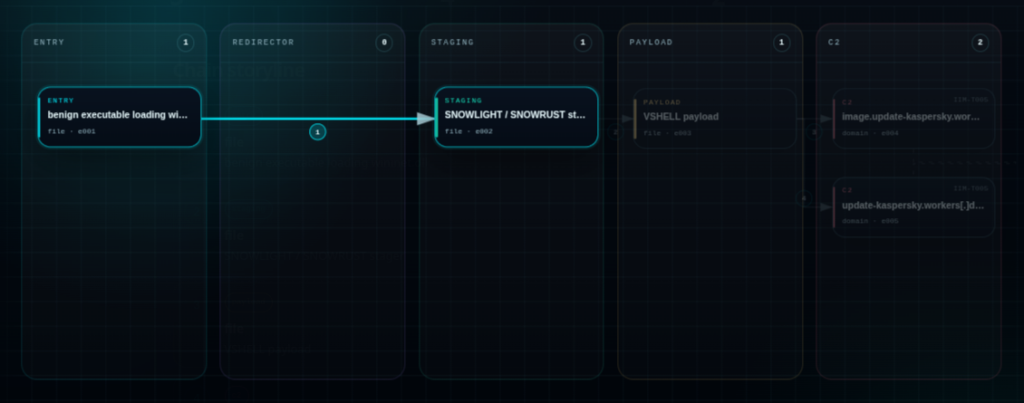
Each element has a role, each connection a relation and each chain can include actor context, campaign context, source references and evidence.
So the question is no longer only:
Which domains were used?The better question becomes:
How did these domains, URLs, payloads and endpoints work together?That is the entire point of the feed.
Why this exists
A lot of public CTI is still flattened too early.
An operation starts as a chain of infrastructure, delivery logic, payloads and backend communication.
By the time it lands in a feed, it often becomes this:
- domain
- ip
- url
- hash
- tag
Great. Technically correct. Also missing half of the useful context.
The problem is not that IOCs are useless.
They are useful.
Blocking, detection, enrichment, correlation, retro-hunting, all of that still needs indicators.
The problem is that an IOC without role and relation is only a fragment.
A domain can be many things.
It can be an entry point, a redirector, host a payload, part of C2, a decoy or it can be unrelated noise that looked interesting for five minutes.
- A hash can be a payload.
- A URL can be staging.
- An IP can be backend infrastructure.
- A compromised site can be part of a delivery chain without being “the actor’s server”.
Without structure, all of that gets thrown into the same bucket.
And then everyone pretends the bucket is intelligence.
What IIM adds
IIM stands for Infrastructure Intelligence Model.
It is a model for describing adversary infrastructure as chains of roles and relations.
The idea is intentionally boring in the best way:
Give infrastructure components a role.
Connect them with meaningful relations.
Keep the evidence attached.
Make the chain readable for humans and usable for machines.
In IIM terms, a component might have a role like:
- entry
- redirector
- staging
- payload
- c2
And relations can describe how components interact:
- redirects_to
- hosts
- downloads
- drops
- communicates_with
- resolves_to
That creates a structured view of the operation.
A way to stop losing the shape of the infrastructure the moment we export the data.
Which, honestly, feels overdue.
What makes feed.iim.malwarebox.eu useful
The website gives these chains a public place.
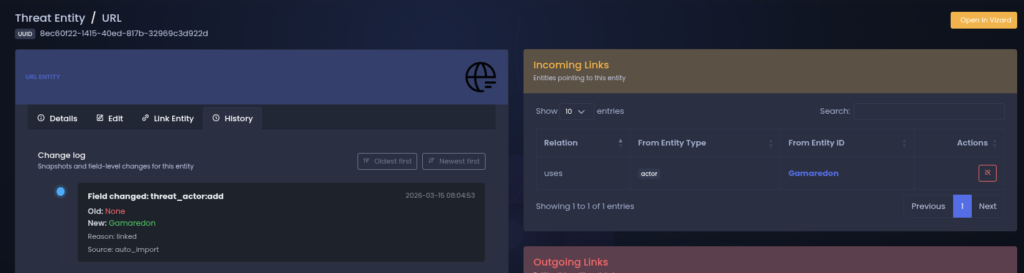
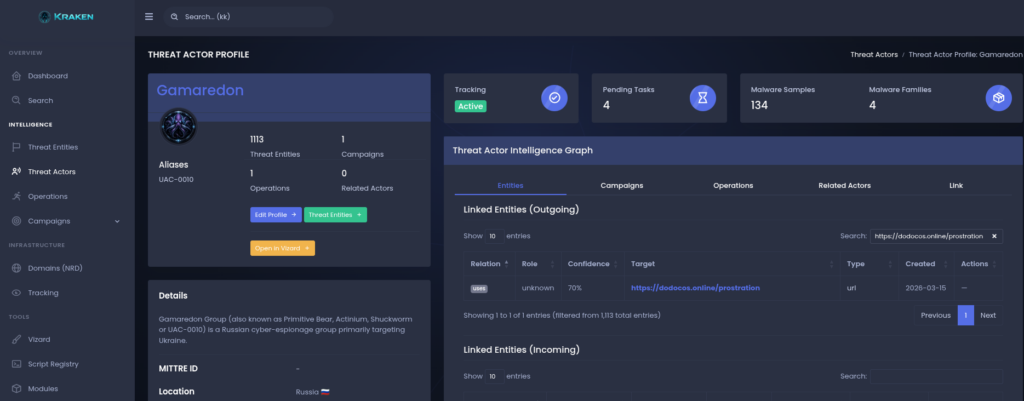
You can look at an actor or campaign and inspect the infrastructure chain behind it.
Instead of reading a paragraph and then scrolling to an IOC appendix, the structure is visible directly.
You can filter by actor and simply click on an available chain to see how the attacker structures their attacks 🙂
The important part is the relationship between objects.
For example:
domain A redirected to URL B
URL B staged payload C
payload C contacted endpoint D
endpoint D was linked to actor/campaign context
That is already much more useful than a flat list.
It shows the path, the role of each object, why an indicator matters and it gives the analyst something to reason about.
This is especially useful when looking across multiple campaigns.
If the same actor keeps using similar layouts, similar staging behavior, similar redirect setups or similar backend separation, that becomes visible as a pattern.
And that is where infrastructure analysis becomes more interesting than “here are five domains, have fun”.
Publication periods & Participating
Malwarebox will regularly use internal and public reports to generate IIM chains, so you can understand how attackers structure their attacks.
If you build your own IIM chains and would like to publish them with us, please feel free to email them to me at contact@malwarebox.eu, including relevant references so we can validate the results (blog posts, write-ups, etc.).
Since I’ve been doing most of the work on my own so far, I’ve now put together a small team, but we’d love to grow 🙂
If you’d like to join the current initiative (publishing analyses, development) or support us in other ways (e.g., financially, *this work isn’t cheap* or through evaluation), please feel free to contact us at the email address above, every bit of support helps us improve and move faster!
Why this matters for adversary understanding
Understanding adversaries is not only about naming them.
Actor names are useful, but they are also messy. Different vendors use different names, clusters shift, overlaps happen, confidence changes and sometimes everyone is clearly talking about related activity while pretending the naming situation is totally fine.
Classic CTI moment.
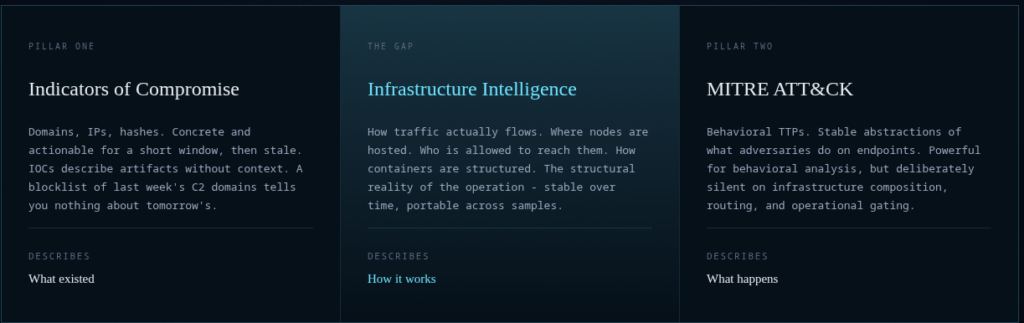
Infrastructure gives another angle.
- How does the actor deliver payloads?
- Do they use redirectors?
- Do they rely on compromised infrastructure?
- Do they separate staging and C2?
- Do they reuse backend systems?
- Do they rotate only the visible front layer?
- Do they make the same operational mistakes repeatedly?
Those questions are not answered well by a hash list.
They are also not fully answered by ATT&CK technique IDs.
ATT&CK is good for behavior.
Malware databases are good for malware family knowledge.
IOC feeds are good for indicator distribution.
The IIM feed focuses on the infrastructure chain.
That is the missing public layer I care about here.
Where Mantis fits in
The feed is connected to the wider Malwarebox ecosystem.
Mantis is used as an internal place to collect, reverse engineer and process malware samples, metadata and related observations.
Some of that context can then be turned into structured IIM chains and published through the public feed.
So the flow is roughly:
Mantis
  -> collect / import / enrich observations

IIM
  -> model infrastructure as roles and relations

IIM Public Feeds
  -> publish selected chains in a browsable form

Malwarebox
  -> connect chains with research, actor pages and defensive context
That connection is important.
The feed is not meant to be a random gallery of graphs. It is meant to become a public layer where selected infrastructure chains from real research and observations can be exposed in a consistent format.
This is attack pattern mapping on the infrastructure layer
The easiest way to describe the idea is probably this:
IIM Public Feeds map attack patterns on the infrastructure layer.
The focus is how adversaries compose infrastructure during operations.
- Delivery paths
- Redirect layers
- Staging locations
- Payload hosting
- C2 exposure
- Reuse across campaigns
- Relationships between moving parts
That gives defenders and analysts a different view.
- A single domain may be dead tomorrow.
- A payload URL may disappear.
- A hosting provider may suspend the server.
- The campaign may rotate visible infrastructure.
But the way the operation is structured can still tell you something.
Sometimes the structure is clean, sometimes it is messy, sometimes it is lazy and sometimes it is surprisingly consistent.
All of that is analytical signal for us 🙂
Why public access matters
A lot of infrastructure mapping already happens somewhere.
In private vendor platforms, internal analyst graphs, screenshots inside PDFs, notes that never leave a team, spreadsheets with names like apt_infra_final_v4_REAL.xlsx.
That is fine for internal workflows, but it does not create a public reference layer.
Public IIM chains can be linked.
They can help students, researchers and defenders understand operations faster.
That is one of the reasons I wanted this to be visible on a public website.
This could also become a large-scale disruptive measure if it gains widespread adoption.
Until then, we will continue to publish updates and refine our approach wherever possible.
How this fits next to existing sources
The goal is not to replace existing projects.
Malpedia is useful for malware family knowledge.
ATT&CK is useful for behavioral technique mapping.
ThreatFox and similar feeds are useful for indicators.
MalwareBazaar & Co are useful for samples.
Reports are useful for narrative analysis.
IIM Public Feeds sit next to those layers and focus on the infrastructure structure.
A simple way to put it:
Malpedia: What malware family are we looking at?
ATT&CK: What behavior and techniques are involved?
IOC Feeds: Which indicators were observed?
IIM Feeds: How was the adversary infrastructure chained together?
That is the niche.
And yes, it is specific.
Good. Specific is useful.
Where IIMQL fits in
The feed website is only the visible part of the whole thing.
The plan is to publish new IIM feeds regularly. Some chains will come from our own internal analysis and Malwarebox research. Others will be based on public reports where the infrastructure can be reconstructed cleanly enough to turn it into an IIM chain.
And yes, we are also open to community submissions.
If someone has mapped an infrastructure chain from a report, a campaign, a sample set or their own research, that chain should not die in a screenshot, a tweet thread or a local notes folder named apt-stuff-final-final.json.
It can be turned into an IIM feed.
That is also where IIMQL becomes interesting.
IIMQL is the query language around IIM.
The idea is simple: once infrastructure chains are structured, they should also be searchable in a structured way.
At some point, you do not only want to look at one chain. You want to ask questions across many chains.
For example:
- Show me all chains where an entry node redirects to a staging node
- Find all payload delivery chains connected to a specific actor
- Show campaigns where the C2 role appears behind a reused staging layer
- Find infrastructure patterns where compromised websites are used before payload delivery
- Show all chains that contain the same relation pattern across different actors
That is the part where this stops being just a nice public viewer and starts becoming useful as an actual research layer.
- One chain is interesting
- Ten chains are useful
- A hundred chains start to show patterns
That is why the feed format matters.
If we publish chains in a consistent model, IIMQL can later query across them instead of forcing everyone to manually compare screenshots, IOC tables and half-structured report snippets.
The next logical step would be an IIMQL-based search tool on top of the public feed data.
Search by role, relation, actor, chain layout, repeated infrastructure pattern or campaign context.
Basically a way to ask questions against the infrastructure layer directly.
That needs enough data to be useful, though.
A query language without chains is just a very sophisticated way to return nothing.
So for now the focus is simple: publish more IIM chains, keep the format consistent, accept useful community feeds and build the public corpus.
Once there is enough material, IIMQL becomes the natural interface on top of it.
More on that later.
What comes next
The feed website is the public starting point.
From here, the useful next steps are pretty obvious:
- Campaign-based chain views
- Better evidence panels
- Pattern comparison
- IIMQL integration.
The goal is to make the infrastructure layer easier to inspect, compare and reason about.
Because CTI has a structure problem.
We keep collecting more indicators, more reports, more aliases, more screenshots and more tables.
Then analysts still have to reconstruct the actual operation manually.
The feed is one attempt to make that part less stupid.