by Robin Dost
Part 1 of 7 of building the Malwarebox Ecosystem
Official Website: https://kraken.malwarebox.eu
Whitepaper
Tracking Gamaredon infrastructure is frustrating.
Domains rotate.
IPs disappear.
Dead-drops change.
And your IOC list is outdated before your report is even finished.
This is exactly where traditional tracking breaks.
Infrastructure is not a list.
It’s a system.
So instead of chasing indicators, I built something else: Kraken.
An actor-centric platform that tracks infrastructure as a continuously evolving graph.
Over the past months I used Kraken to follow Gamaredons infrastructure rotations, automatically expand clusters via passive DNS, dead-drop resolution, additional enrichment and keep visibility even as things change.
Kraken is still in evaluation, but it already shows why this approach works.
Gamaredon is basically the perfect test case: fast rotations, simple patterns, constant change.
Annoying if you rely on IOC lists.
Interesting if you actually track the system behind it.
The Problem
The core problem is simple:
Most threat intelligence workflows are still indicator/ioc-centric.
Indicators are collected, stored and shared as lists.
But infrastructure operated by threat actors is not a list.
It is a system.
Domains resolve to IPs
IPs host multiple domains
Dead-drops reference infrastructure
Passive DNS reveals historical relationships
Once you model these relationships as a graph and not as a list, entirely new analysis possibilities show up.
Methodology
I do not collect indicators and throw them into another IOC list as I often did before, my approach used here focuses on tracking infrastructure as a system.
Gamaredon infrastructure changes constantly. Domains rotate, IPs disappear, new dead-drops appear and old ones quietly vanish again. If you try to track this using static indicator lists you quickly run into a simple problem:
your data ages faster than your report.
So instead of treating indicators as the final result, they are treated as entry points.
Each domain, IP address or dead-drop reference becomes a starting node from which additional infrastructure can be discovered through relationships.

Actor-Centric Tracking
The key idea behind this is fairly simple.
I do not just track indicators, the whole tracking process focuses on the actor and the infrastructure ecosystem they operate.
Indicators are therefore not stored as isolated artifacts but as nodes within a larger infrastructure graph.
Some examples:
- Domains resolve to IP addresses
- IP addresses host multiple domains
- Dead-drop channels reference infrastructure
- Passive DNS exposes historical relationships between these elements
When you follow these relationships consistently, infrastructure clusters start to emerge on their own, just by letting Kraken collect data by itself.
Continuous Collection
Manual lookups are fine for small investigations, but they do not scale well when tracking infrastructure that changes constantly.
To deal with this problem, infrastructure collection is automated through small collection pipelines which continuously process new data as it arrives.
These pipelines typically follow a very simple structure:
Source > Extract > Normalize > Enrich
A source may be a Telegram channel used as a dead-drop, a blog platform or any location where infrastructure information can be found.
Once infrastructure artifacts such as domains or IP addresses are extracted, they are normalized and passed to enrichment stages which attempt to expand the infrastructure footprint.
Infrastructure Graph
All observed artifacts and relationships are stored within an intelligence graph.
Nodes represent infrastructure elements, while edges in the graph represent observed relationships between them.
This model makes it possible to pivot through infrastructure in multiple directions and observe how infrastructure clusters evolve over time.
In practice this basically turns infrastructure tracking into a continuous mapping process (rather than a one time indicator collection exercise).
Data Collection
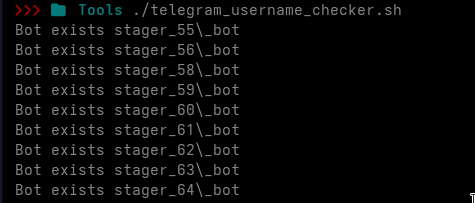
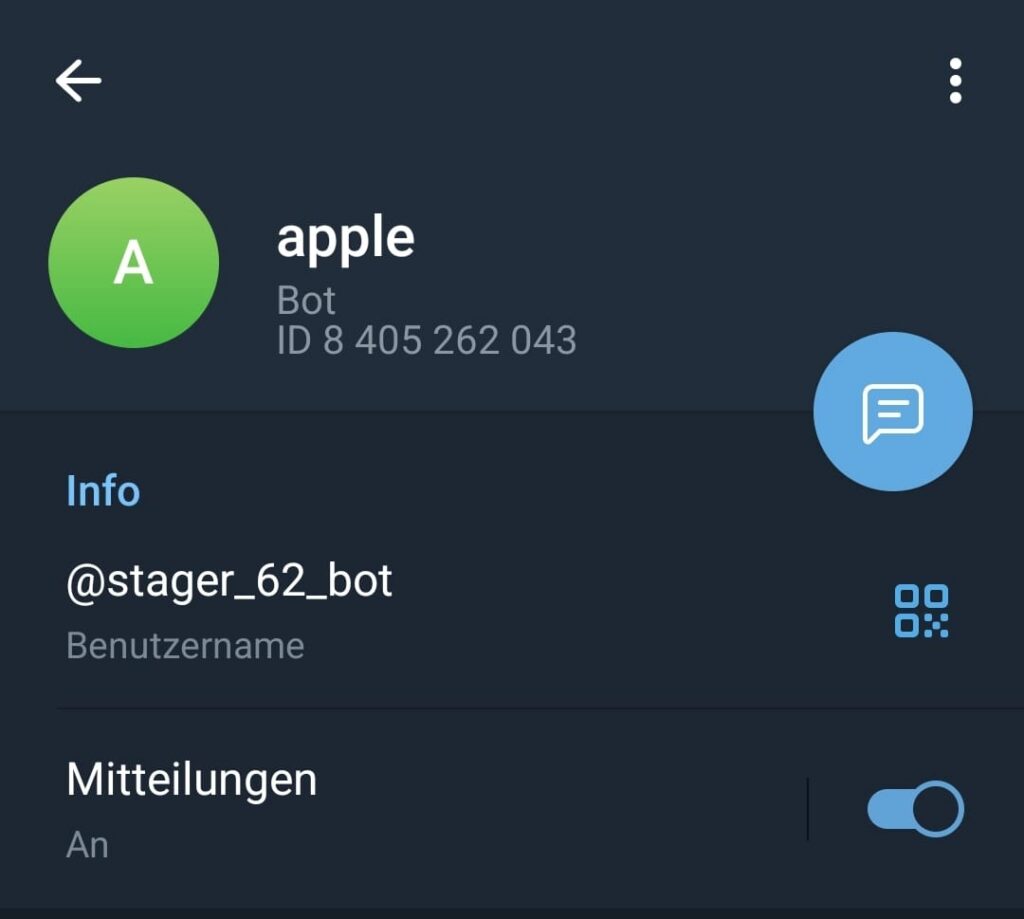
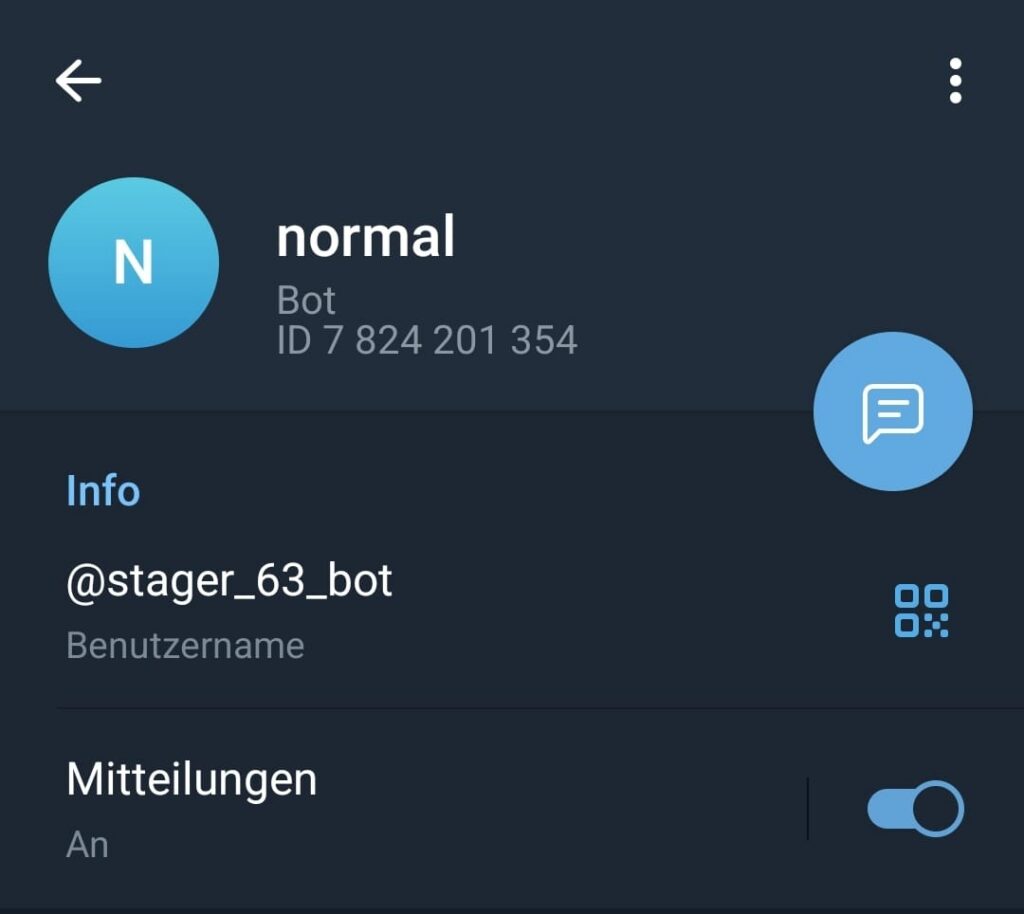
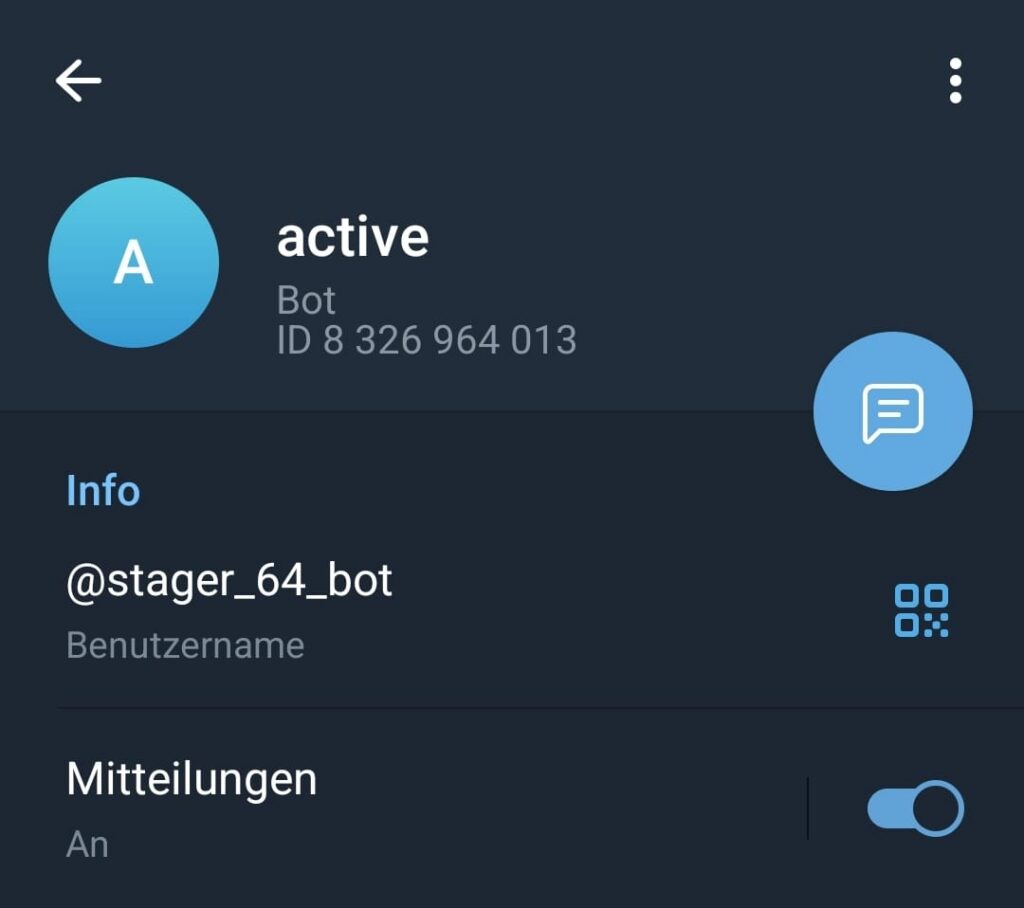
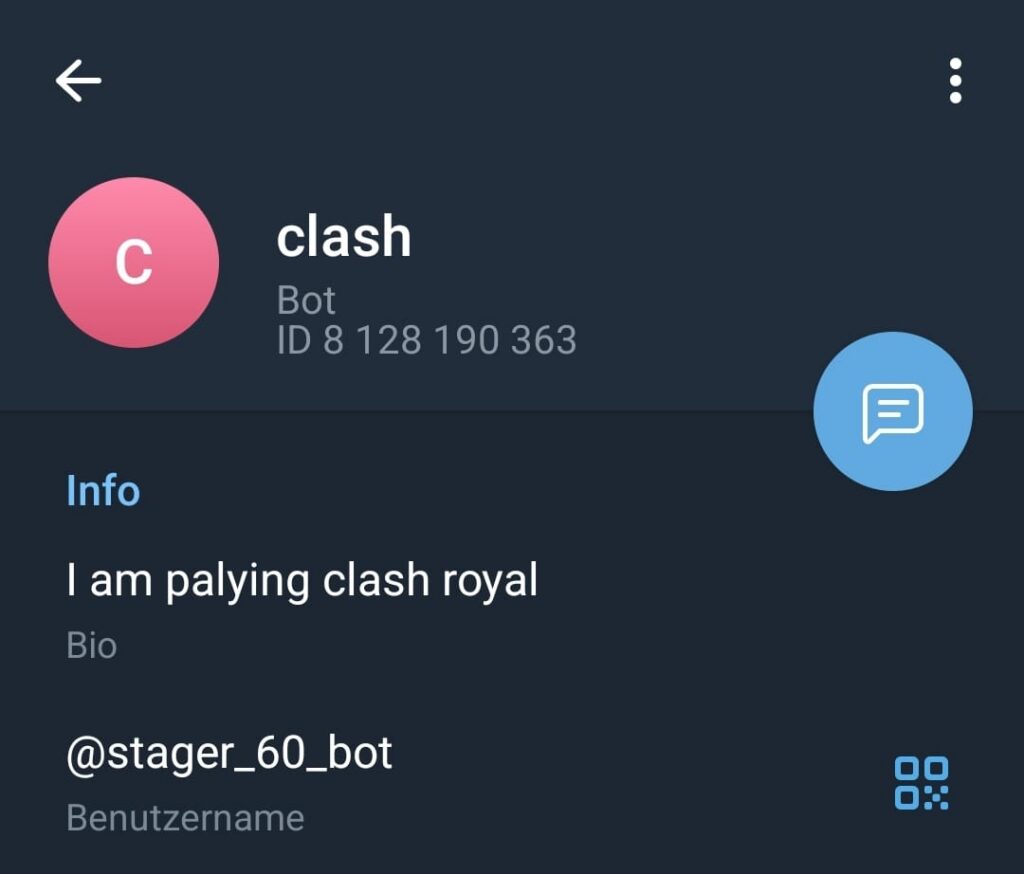
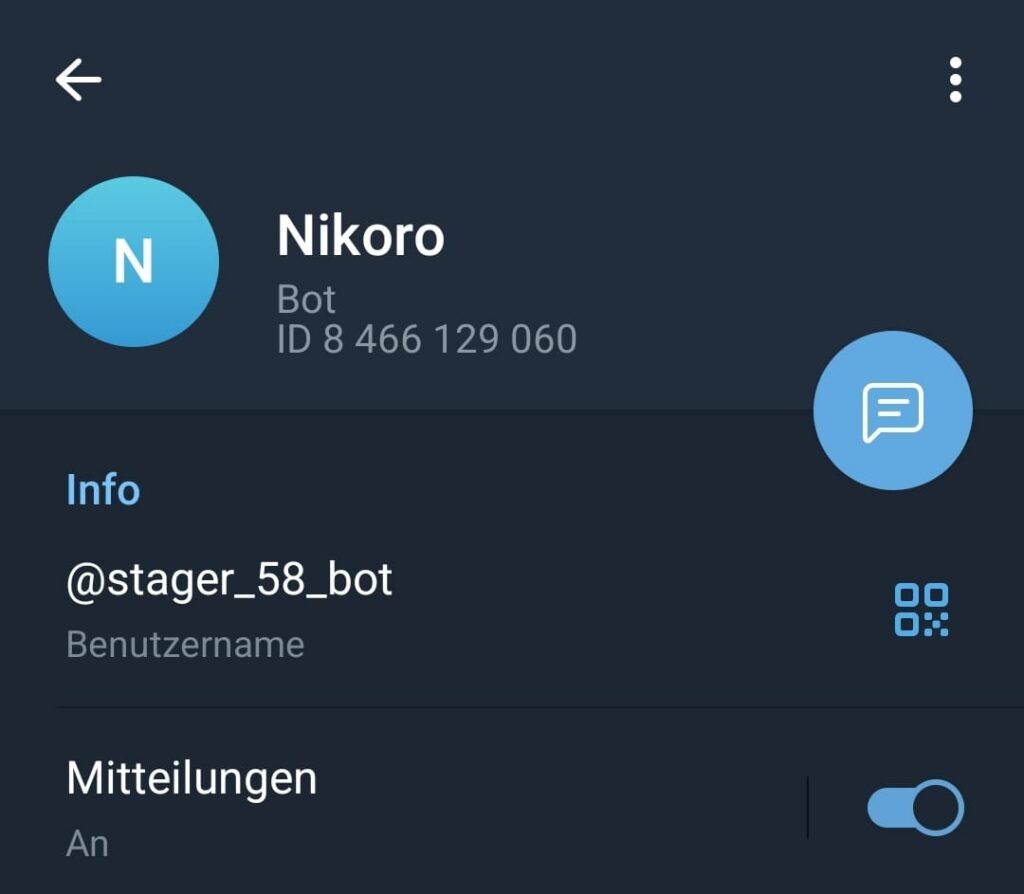
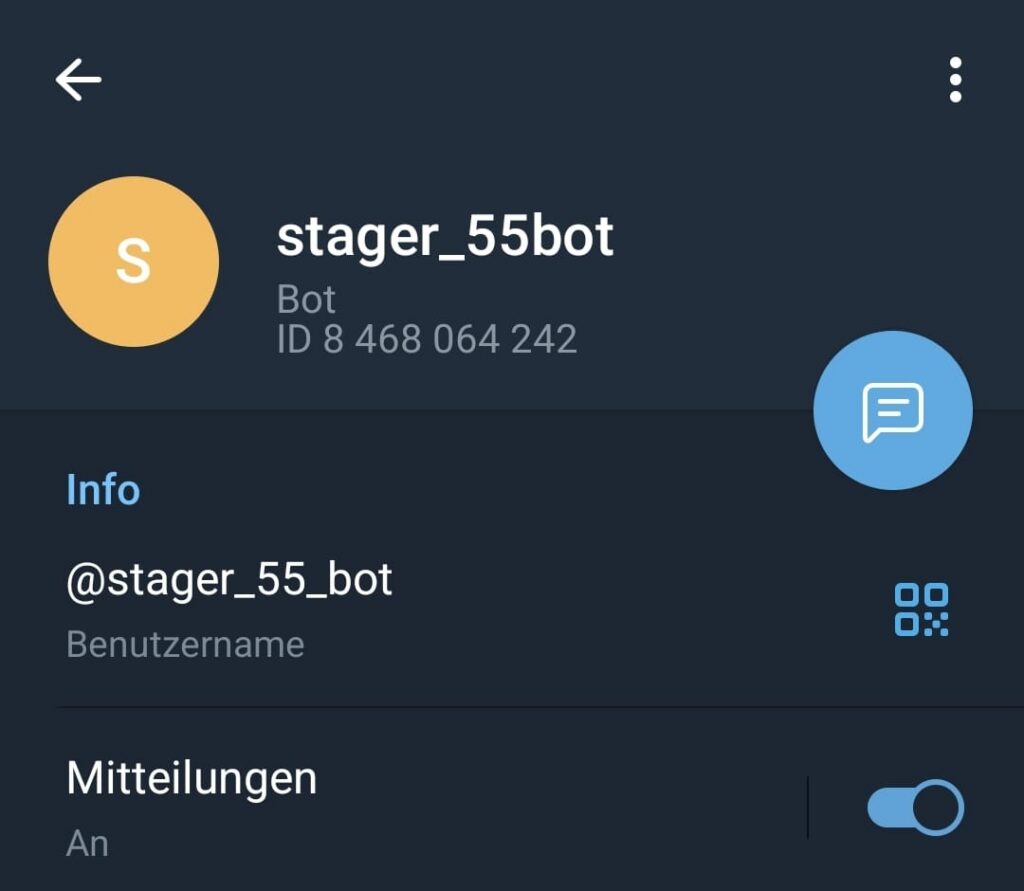
A common pattern observed in Gamaredon operations is the use of publicly accessible locations to distribute infrastructure references.
These locations often act as so called “dead-drops”: pages or channels that contain references to infrastructure which can later be used by infected systems or operators.
We do not have to manually monitoring these sources anymore. The collection process is fully automated. A small collection pipeline periodically retrieves the content of known dead-drop locations and attempts to extract infrastructure artifacts such as domains, (worker) URLs or IP addresses.
Once a reference is identified, the artifact is normalized and passed into the intelligence pipeline where it can be processed further.
Figure 1 shows an example of such a collection run.
The pipeline processes a known dead-drop location and extracts a URL which is later used as a pivot point for more additional infrastructure discovery.
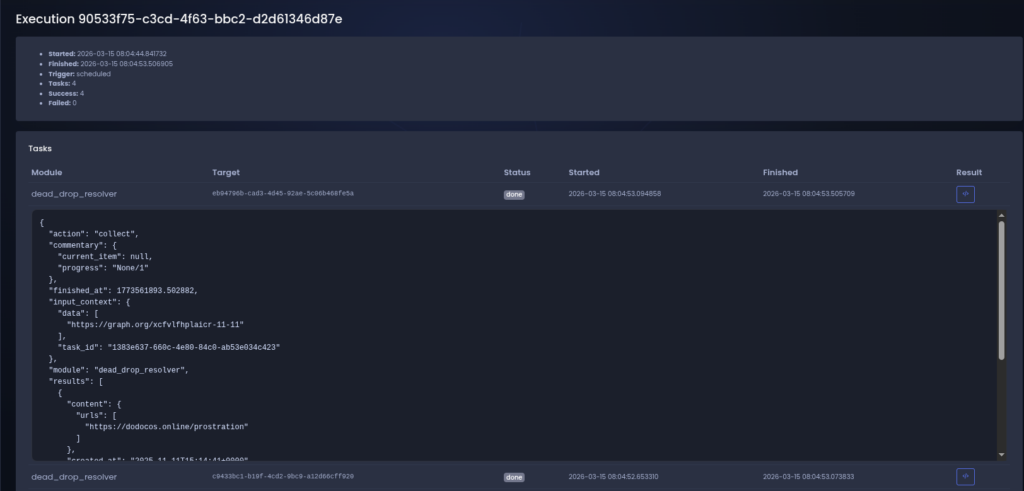
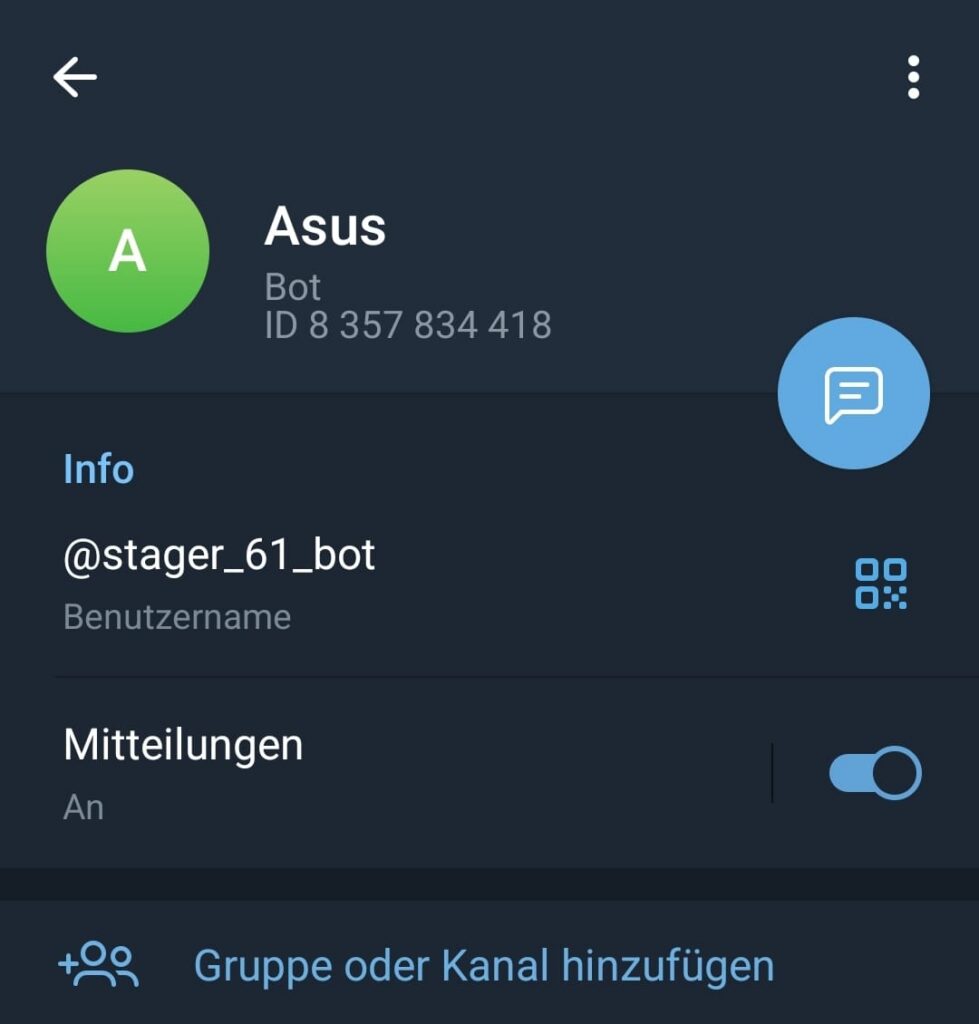
After the automatic extraction, the discovered artifact is converted into a structured entity within the intelligence model.
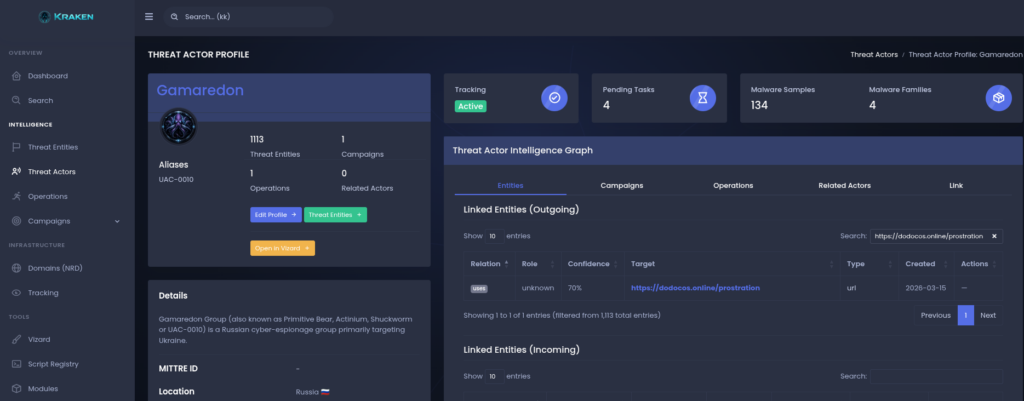
The artifact becomes a first-class infrastructure entity, which allows the system (and analyst) to attach metadata, track historical observations and establish relationships with other intelligence objects.
In this case, the extracted URL is automatically linked to the Gamaredon threat actor, making it possible to track the infrastructure within the context of the actors operational ecosystem.
Figure 2 shows the extracted URL represented as an infrastructure entity.
The system records the relationship between the artifact and the threat actor, allowing future pivots across related infrastructure elements.
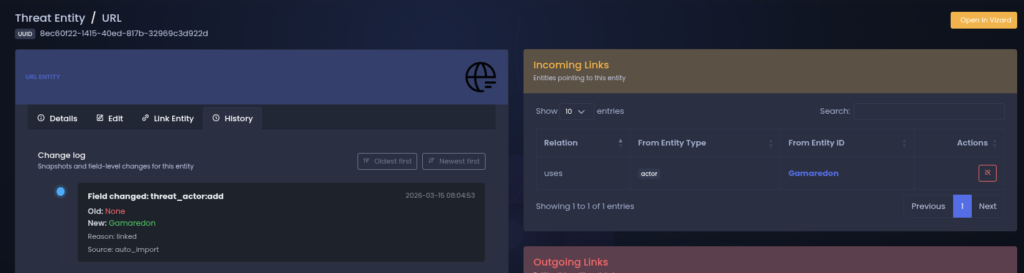
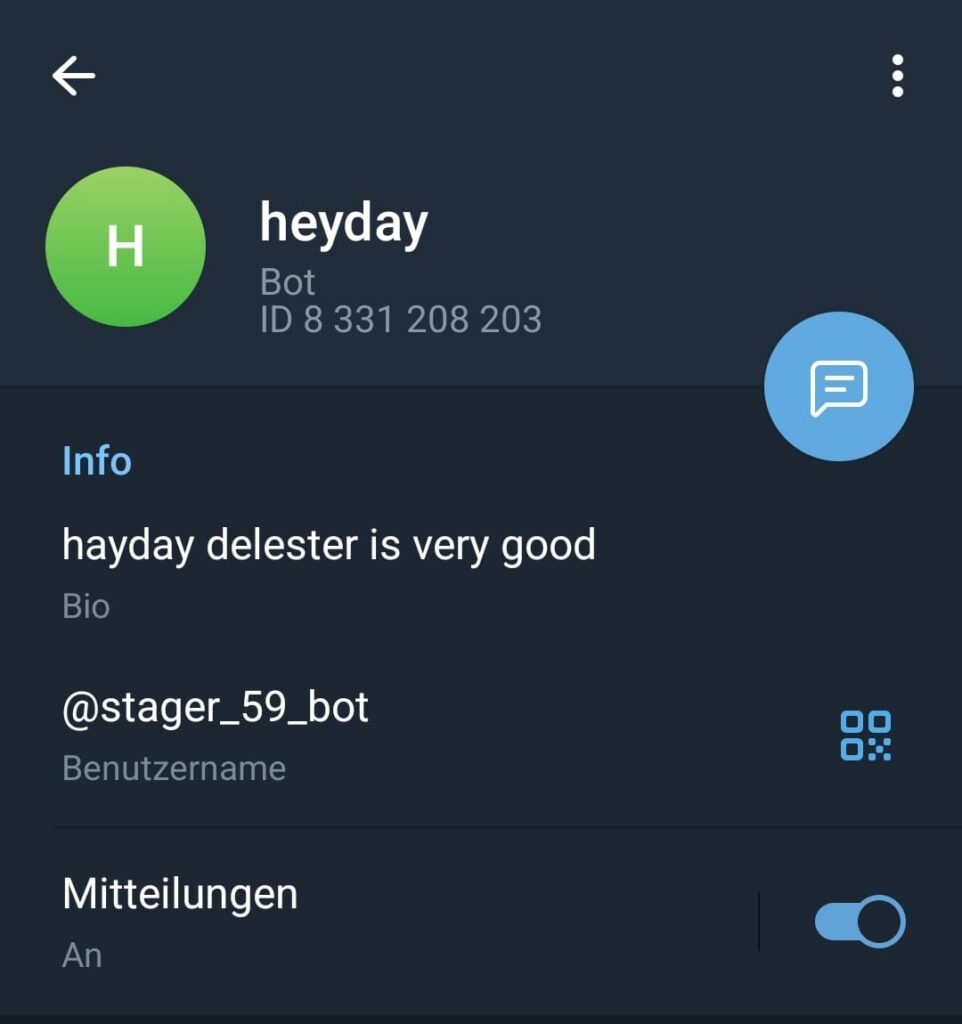
Once infrastructure artifacts are linked to an active actor, they become part of the actors evolving infrastructure graph.
This helps analysts to observe how infrastructure elements connect to each other over time and it makes it possible to pivot between entities and communication channels associated with the actor.
I usually do not investigating isolated indicators anymore, because i can observe the structure of the infrastructure ecosystem operated by the threat actor.
Figure 3 shows the Gamaredon actor profile with linked infrastructure entities that were discovered through automated collection pipelines.
Automated Tracking Pipeline
Collecting infrastructure once is rarely useful when dealing with actors like Gamaredon.
Infrastructure appears, disappears and reappears somewhere else. Domains rotate, IP addresses change and new dead-drops appear regularly.
A single snapshot of indicators therefore provides very limited value.
To deal with this, infrastructure tracking is performed within automated tracking pipelines.
A tracking pipeline is essentially a small workflow which periodically collects infrastructure artifacts, processes the results and finally feeds newly discovered artifacts back into the intelligence graph 🙂
Instead of performing manual enrichment during an investigation, the pipeline continuously performs these steps in the background.

Pipeline Structure
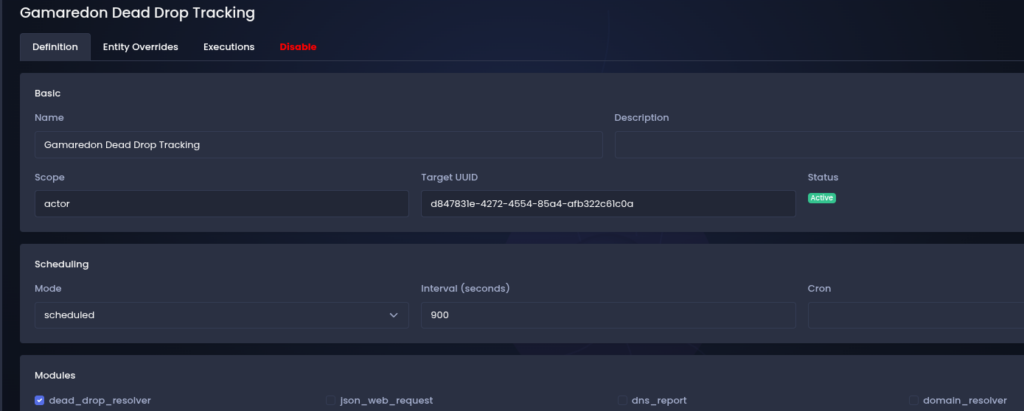
Each tracking pipeline follows a simple structure.
A tracking definition specifies what should be monitored and how the resulting artifacts should be processed.
Once triggered, the pipeline executes a series of collection and enrichment modules we selected in our definition.
These modules are responsible for extracting infrastructure artifacts, normalizing them and expanding the infrastructure footprint through our additional data source.
Scheduling and Execution
Tracking pipelines run on a scheduled basis and automatically process new data as it appears.
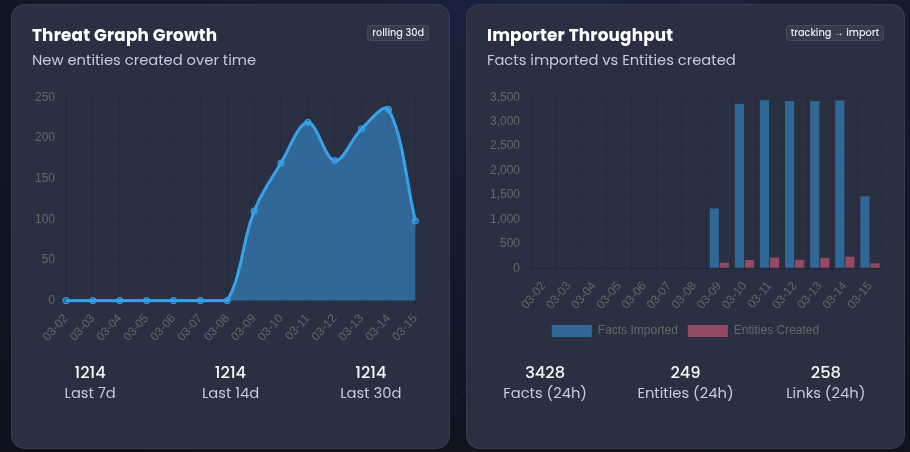
Each execution produces a structured result set which is evaluated by the processing stage of the pipeline. Newly discovered artifacts are converted into infrastructure entities and linked to the relevant threat actor.
Over time this allows the intelligence graph to grow organically as new infrastructure elements are discovered and related artifacts are connected through historical observations.
Result
In practice this means that infrastructure tracking no longer depends on manual analyst activity.
Once a tracking definition has been configured, the pipeline continuously monitors the relevant sources and expands the actors infrastructure graph as new artifacts appear.
Gamaredon Infrastructure Tracking
To demonstrate how the tracking pipeline operates in practice, i configured a small Gamaredon tracking definition to monitor known dead-drop locations used by the actor.
These locations often contain URLs or domains which later or currently appear in malicious campaigns.
The tracking pipeline periodically retrieves the content and extracts infrastructure artifacts which can then be used as starting points for further analysis.
Extraction
During one such collection run, the pipeline processed a known dead-drop location and extracted a URL which had not previously been observed within the intelligence dataset.
While a single URL may not appear particularly interesting on its own, it serves as an entry point into the actors infrastructure ecosystem.
Once the artifact enters the tracking pipeline it becomes a pivot point for further enrichment.
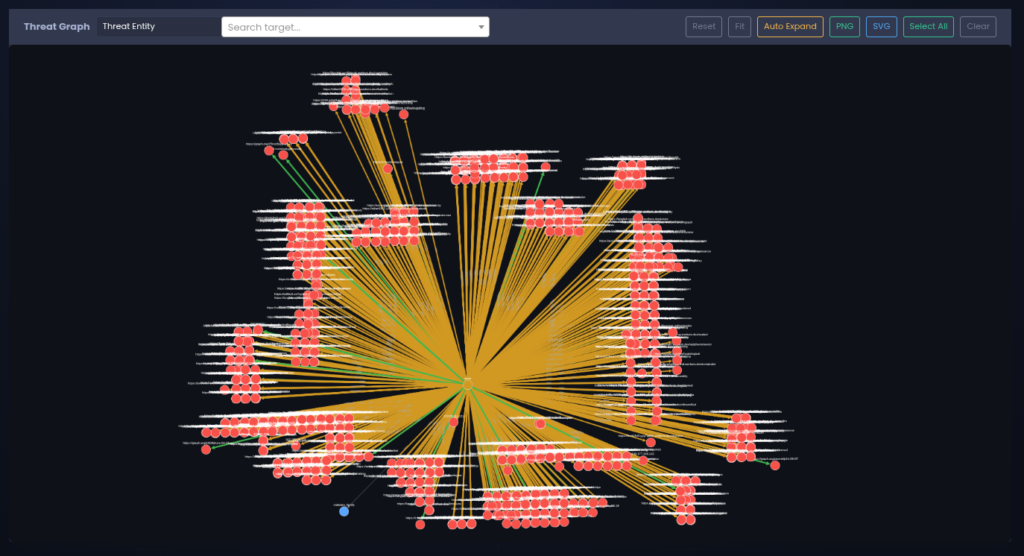
Infrastructure Cluster
Repeated enrichment and pivoting gradually expands the visible infrastructure associated with the actor.
New artifacts discovered through passive DNS or other enrichment sources are automatically linked to the existing actor profile, allowing the infrastructure graph to grow organically as additional relationships are observed.
This process transforms a single infrastructure artifact into a broader cluster of related assets which can be monitored continuously by the tracking pipeline.
Infrastructure Expansion
A single infrastructure artifact rarely provides much information on its own.
A domain or IP address might appear in a dead-drop location, but without additional context it is difficult to determine whether the artifact is actually part of a larger operational infrastructure or simply unrelated noise.
For this reason each newly discovered artifact is treated as a pivot point for further enrichment.
Once an artifact enters the tracking pipeline it is automatically processed by enrichment modules which attempt to expand the observable infrastructure cluster around that artifact.
Passive DNS data is particularly useful for this step.
By examining historical DNS resolutions it becomes possible to identify additional domains that have previously resolved to the same IP address, as well as IP infrastructure that hosted related domains in the past.
While not every discovered artifact will belong to the same actor, this process often reveals clusters of infrastructure which would not be visible when looking at individual indicators in isolation.
As new artifacts are discovered they are automatically added to the intelligence graph and linked to the relevant threat actor when sufficient context is available.
Over time this process gradually expands the visible infrastructure associated with the actor and allows analysts to follow infrastructure rotations across domains, IP addresses and hosting environments.
Findings
Applying the automated tracking pipeline to Gamaredon-related dead-drop locations quickly revealed several patterns in the actors infrastructure usage.
While the dataset used in this analysis is relatively small, a number of observations could already be made regarding infrastructure rotation and clustering behaviour.
Infrastructure Clusters
Passive DNS expansion frequently revealed clusters of domains associated with the same hosting infrastructure.
In several cases multiple domains discovered through enrichment stages resolved to the same IP address or appeared historically connected through shared DNS infrastructure.
These clusters provide additional nodes which may lead to previously unobserved infrastructure related to the actor.
Dead-Drop-Usage
Dead-drop locations appear to play an important role in distributing infrastructure references.
Public platforms such as blogs or messaging channels can be updated quickly and allow operators to rotate infrastructure without modifying malware samples directly.
Monitoring these locations therefore provides an effective entry point for continuous infrastructure discovery.
Value of Continuous Tracking
The observations above highlight the value of continuous infrastructure tracking.
While individual indicators may appear and disappear quickly, the relationships between infrastructure artifacts often persist long enough to reveal broader infrastructure clusters.
By automatically collecting and enriching infrastructure artifacts over time, it becomes possible to map parts of the actors infrastructure ecosystem.
Limitations
While the approach described above proved useful for discovering and tracking infrastructure artifacts, limitations should be taken into account when interpreting the results.
First, infrastructure enrichment based on passive DNS data is inherently incomplete. Passive DNS datasets depend on external collection sources and may not contain the full historical resolution history of a domain or IP address. As a result, certain infrastructure relationships may remain invisible to the analysis.
Second, infrastructure expansion through DNS relationships can produce noise. Shared hosting environments, cloud infrastructure and content delivery networks frequently host unrelated domains on the same IP addresses. Without additional information these relationships can lead to false associations within the infrastructure graph.
Another limitation is that dead-drop monitoring only provides visibility into infrastructure that is publicly referenced by the actor. Infrastructure used exclusively within malware samples or internal command-and-control channels may not appear in these sources and therefore remain outside the scope of this analysis (but i am working on a solution for this c:).
Finally, Kraken itself is currently in evaluation phase. While the platform already supports automated tracking pipelines and infrastructure modeling, additional modules and enrichment sources are still being developed.
Future iterations will improve infrastructure expansion and reduce noise introduced by shared hosting environments.
About Kraken
Kraken is a modular cyber threat intelligence orchestration platform designed for continuous infrastructure tracking and actor-centric intelligence modeling.
It models infrastructure as a relationship graph between domains, IP addresses, communication channels and other infrastructure artifacts. Automated tracking pipelines collect and enrich infrastructure data and continuously extend the intelligence graph when new artifacts appear.
The platform is currently in an evaluation phase (version 0.9.1-eval) and actively developed. Additional collection and enrichment modules are being added to improve infrastructure discovery and analysis capabilities.
A more detailed description of the platform architecture and intelligence pipeline is available in the Kraken technical whitepaper.
To gather early feedback from practitioners in the threat intelligence community, a small number of early evaluation access slots will be made available during 2026. The initial evaluation phase will be limited to ten vetted participants. Interested researchers or organizations can already request consideration for this early access program. Due to the limited number of evaluation slots, requests will go through a strict vetting process before access is granted.
Request access here: https://kraken.malwarebox.eu
Conclusion
Tracking infrastructure operated by threat actors such as Gamaredon requires more than static lists of indicators. Infrastructure changes quickly and isolated artifacts often provide little context on their own.
By combining automated collection pipelines with relationship-based infrastructure modeling, it becomes possible to gradually map portions of an actors infrastructure ecosystem and observe how it evolves over time.
While my approach described in this article represents only a small subset of possible tracking techniques, it demonstrates how automated infrastructure collection and enrichment can support continuous threat intelligence workflows.
Further development of the Kraken platform will focus on expanding collection capabilities and improving infrastructure correlation across multiple data sources.