by Robin Dost
As already mentioned in my last MuddyWater article, I originally planned to take a closer look at the remaining RustyWater samples in the hope of finding additional leftover artefacts. But: writing a pure “let’s grep a few more binaries for leftovers” follow-up article sounded painfully boring, both to read and to write. So instead of doing that, I decided to version the individual samples properly and build a small change-tracking timeline around them.
Mostly out of curiosity, partly out of stubbornness.
At least this way we get something that resembles actual analysis rather than archaeological string hunting.
Before diving into version diffs and timelines, it’s worth briefly grounding what we’re actually dealing with here, without turning this into a full-blown reverse engineering novella.
RustyStealer (sometimes referenced as RustyWater, Archer RAT or related variants in public reporting) is a Rust-based information stealer / RAT that has been observed in MuddyWater-attributed campaigns. In practice it behaves like a fairly typical post-compromise implant: basic host reconnaissance, security product awareness, persistence via registry, C2 communication and modular task execution. Nothing magical, nothing revolutionary, just a modernized tooling stack implemented in Rust instead of the usual C/C++ ecosystem. Here’s an article from cloudseek.com if you are interested in the details of it’s deliver and execution nature.
And that’s exactly where this article deliberately does not go: this is not a line-by-line teardown of every decoding routine, syscall wrapper or math loop. There are already reports on the internet that lovingly explain how a single function increments a counter.
What I’m interested in instead is how this thing evolves over time and how to track it
How do the binaries change between builds?
Which libs appear or disappear?
When does the architecture shift?
Where do experiments get rolled back?
Which parts get hardened, obfuscated or simplified?
The goal is to treat this malware family more like a software project with a messy commit history than a static artifact. By correlating compile timestamps, dependency fingerprints, fuzzy hashes, embedded artefacts and targeted code diffs, we can reconstruct a surprisingly coherent development timeline and extract signals about tooling maturity, experimentation phases and operational priorities .
And honestly: that’s way more fun than grepping strings all day and more useful for my threat actor research
For the analysis I used the following samples:
| Hash | Date |
| e081bc408f73158c7338823f01455e4f5185a4365c8aad1d60d777e29166abbd | 08.01.2026 |
| ddc6e6c76ac325d89799a50dffd11ec69ed3b5341740619b8e595b8068220914 | 08.01.2026 |
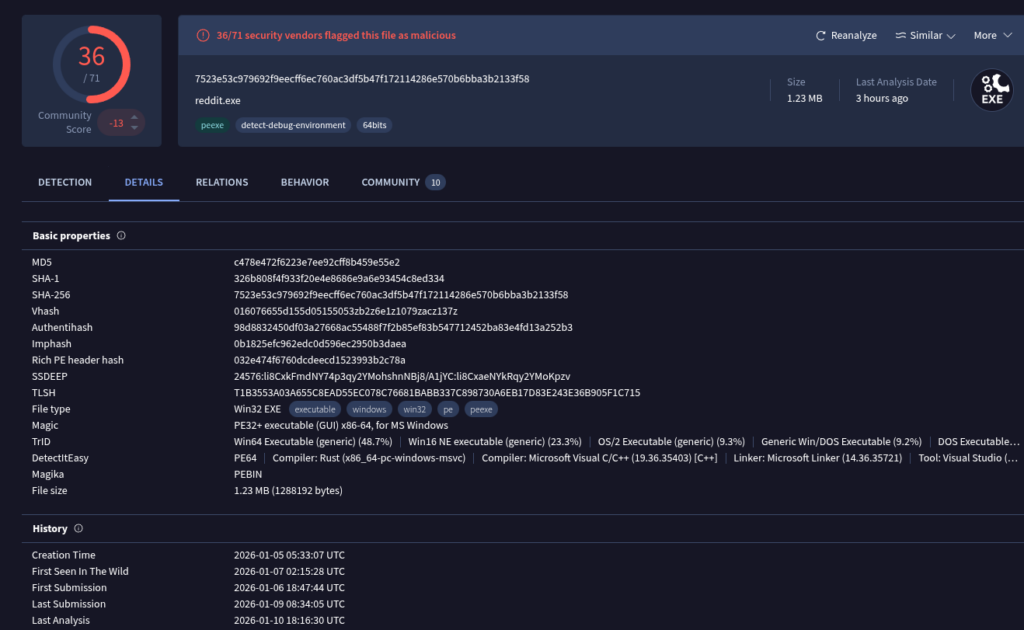
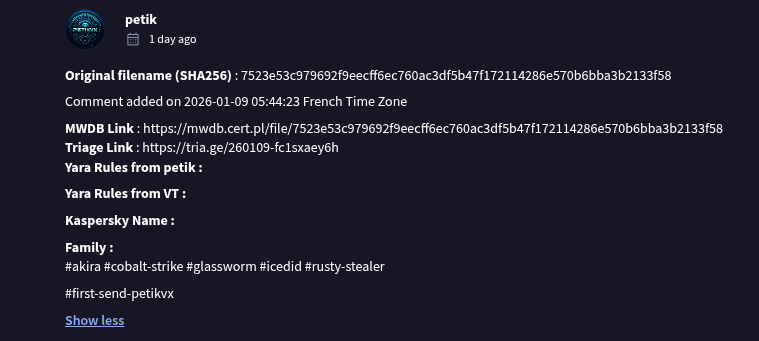
| 7523e53c979692f9eecff6ec760ac3df5b47f172114286e570b6bba3b2133f58 | 08.01.2026 |
| e61b2ed360052a256b3c8761f09d185dad15c67595599da3e587c2c553e83108 | 08.01.2026 |
| a2001892410e9f34ff0d02c8bc9e7c53b0bd10da58461e1e9eab26bdbf410c79 | 10.01.2026 |
My First Step: I always start with the most low-effort signal: raw strings.
Sometimes you get lucky and developers leave behind absolute paths, usernames, toolchain artefacts or other accidental breadcrumbs.
The first thing I wanted to verify was whether any additional user paths were embedded in the samples:
for x in *.exe; do strings "$x" | r="$(strings "$x" | grep 'C:')"; if ! [ -z "$r" ]; then echo "$x $r\n"; fi ; done 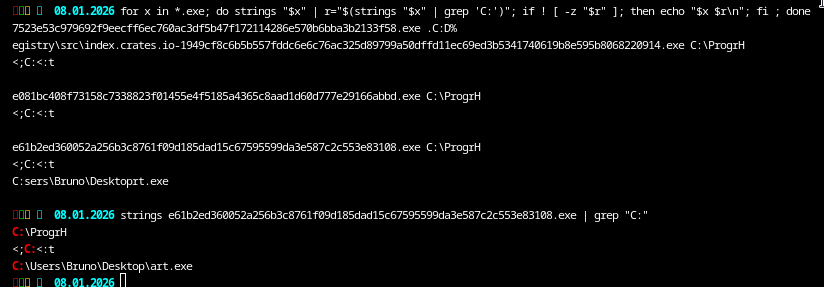
And yes, in two of the binaries we do indeed find another leftover artefact:
C:\Users\Bruno\Desktop\art.exe
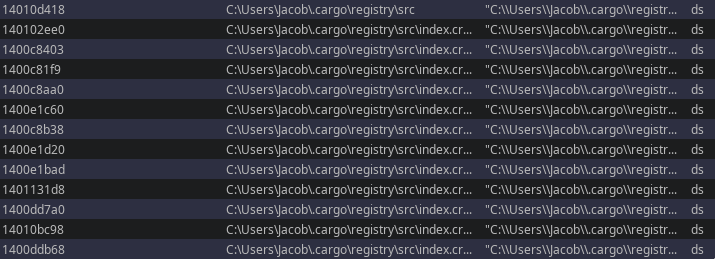
C:\Users\Jacob\...Just to be clear: the developer is almost certainly not named Bruno/Jacob.
This is simply the username of the build environment used at that time. Still, it gives us a nice anchor point when correlating samples later on.
Dependency extraction and library fingerprinting:
Next, I wanted to extract the dependency information from the binaries:
# get llvm strings
for x in *.exe; do strings "$x" | r="$(strings "$x" | grep 'llvm')"; if ! [ -z "$r" ]; then echo "$x $r\n"; fi ; done
# get crates with version and write to file sample.exe.strings
for x in *.exe; do strings "$x" | grep "crates\.io-" | cut -d'\' -f5 | sort | uniq >> "$x.strings" ;  done
This gives us a list of Rust crates and libraries that were present at build time:
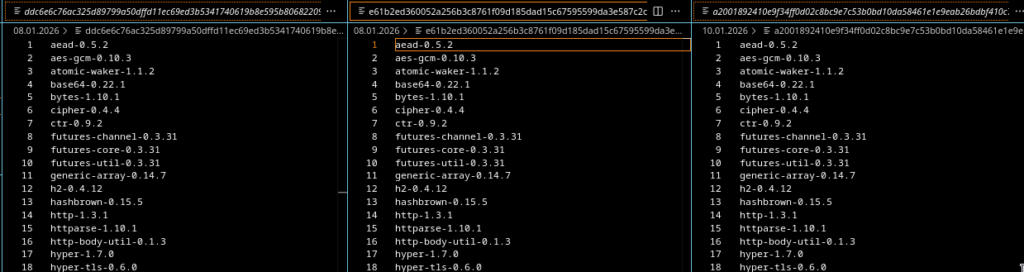
From this output I consolidated a full list of all dependencies observed across all samples.
It already allows a first sanity check: are all samples built from the same dependency set or do we see deviations?
In total, the consolidated list contains 50 libraries, however, each individual sample only exposes around 44-45 crates.
That already tells us that not all builds are identical.
Here is the full list of observed libraries:
| Library | Version |
| aead | 0.5.2 |
| aes | 0.8.4 |
| aes-gcm | 0.10.3 |
| atomic-waker | 1.1.2 |
| base64 | 0.22.1 |
| bytes | 1.10.1 |
| cipher | 0.4.4 |
| ctr | 0.9.2 |
| futures-channel | 0.3.31 |
| futures-core | 0.3.31 |
| futures-util | 0.3.31 |
| generic-array | 0.14.7 |
| h2 | 0.4.12 |
| hashbrown | 0.15.5 |
| http | 1.3.1 |
| httpparse | 1.10.1 |
| http-body-util | 1.7.0 |
| hyper | 1.7.0 |
| hyper-tls | 0.6.0 |
| hyper-utils | 0.1.16 |
| icu_collections | 2.0.0 |
| icu_normalizer | 2.0.0 |
| idna | 1.1.10 |
| indexmap | 2.11.0 |
| ipnet | 2.11.0 |
| iri-string | 0.7.8 |
| mio | 1.0.4 |
| native-tls | 0.2.14 |
| percent-encoding | 2.3.2 |
| rand | 0.6.5 |
| rand_core | 0.4.2 |
| rand_hc | 0.1.0 |
| rand_jitter | 0.1.4 |
| reqwest | 0.12.23 |
| schannel | 0.1.27 |
| slab | 0.4.11 |
| smallvec | 1.15.1 |
| socket2 | 0.6.0 |
| tokio | 1.47.1 |
| tokio-native-tls | 0.3.1 |
| tokio-util | 0.7.16 |
| tower | 0.5.2 |
| universal-hash | 0.5.1 |
| url | 2.5.7 |
| utf8_iter | 1.0.4 |
| want | 0.3.1 |
| windows-registry | 0.5.3 |
| winreg | 0.55.0 |
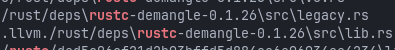
| rustc-demangle | 0.1.24 |
| rustc-demangle | 0.1.26 |
Since we now know that differences exist, I built a per-sample matrix to visualize which libraries appear in which binary:
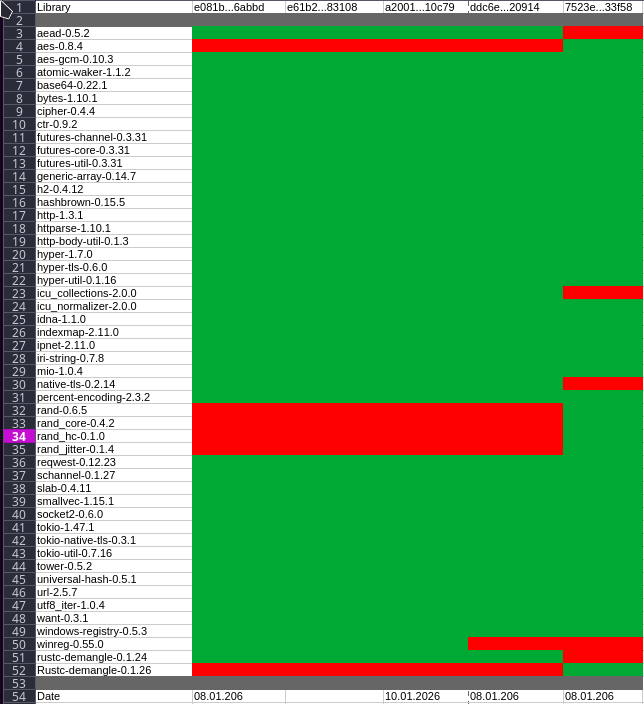
This makes deviations immediately visible without having to manually diff text dumps.
Compile timestamps
Before grouping anything, I also checked when the individual binaries were compiled.
This can be extracted using:
for x in *.exe; do printf "$x"; objdump -x "$x" | grep "Time/Date"; donResult:
| File Hash | Compile Date |
| ddc6e6c76ac325d89799a50dffd11ec69ed3b5341740619b8e595b8068220914 | Tue Sep 23 10:44:52 2025 |
| e081bc408f73158c7338823f01455e4f5185a4365c8aad1d60d777e29166abbd | Sun Oct 19 21:17:34 2025 |
| e61b2ed360052a256b3c8761f09d185dad15c67595599da3e587c2c553e83108 | Sun Nov 16 23:41:42 2025 |
| a2001892410e9f34ff0d02c8bc9e7c53b0bd10da58461e1e9eab26bdbf410c79 | Sun Nov 16 23:41:42 2025 |
| 7523e53c979692f9eecff6ec760ac3df5b47f172114286e570b6bba3b2133f58 | Mon Jan 5 06:33:07 2026 |
TLSH similarity analysis
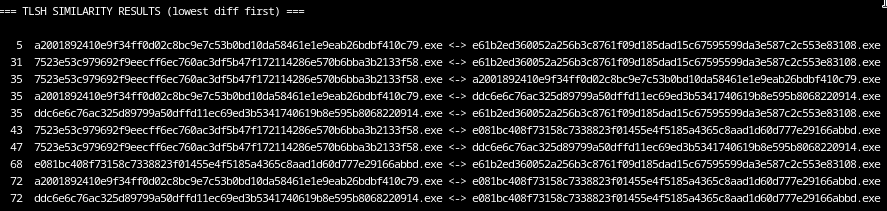
As a final preprocessing step I generated TLSH hashes for all samples.
TLSH is a fuzzy hashing algorithm that does not aim for exact equality, but instead quantifies structural similarity between files.
Unlike cryptographic hashes, TLSH allows us to estimate how closely two binaries resemble each other internally even if they differ in resources, padding, timestamps or small code changes.
For our malware analysis purpose, this is especially useful when clustering variants, detecting rebuilds and separating development branches.
To make the distances reproducible, I wrote a small script that computes TLSH values directly from the binaries and performs pairwise comparisons:
Clustering the samples
With all of this data available, we can now perform a reasonably robust clustering of the samples
The key point here is that no single metric is deciding on its own. Instead, the correlation of multiple independent signals matters:
- TLSH similarity
- Compile timestamps
- Library fingerprints
- Embedded user artefacts
Cluster 1: Core codebase
The first cluster represents the actual core of the codebase and contains the samples:
e081bc408f73158c7338823f01455e4f5185a4365c8aad1d60d777e29166abbde61b2ed360052a256b3c8761f09d185dad15c67595599da3e587c2c553e83108a2001892410e9f34ff0d02c8bc9e7c53b0bd10da58461e1e9eab26bdbf410c79
All three share identical lib dependencies and are compiled close together in time, two of them even share the exact same compile timestamp. One sample also contains the user artefact "Bruno", which further hints to a consistent build environment.
Despite moderate TLSH distance to some variants, the internal similarity inside this cluster remains high enough to confidently assume a shared codebase.
Cluster 2: Early feature branch
A second, clearly separable cluster consists solely of:
ddc6e6c76ac325d89799a50dffd11ec69ed3b5341740619b8e595b8068220914
This sample extends the otherwise stable library stack with an additional winreg dependency while remaining TLSH-close to the core samples.
Combined with its earlier compile timestamp, i think this a temporary feature branch or experiment rather than a fully independent development line.
Cluster 3: Later modernization branch
The third cluster is represented by:
7523e53c979692f9eecff6ec760ac3df5b47f172114286e570b6bba3b2133f58
The build differs by multiple additional libraries and introduces a newer version of rustc-demangle.
Additionally, a different username ("Jacob") appears in the artefacts.
While the TLSH distance still places this sample within the same family, it consistently sits outside the tighter core cluster range.
Taken together, this strongly indicates a later development branch with an updated toolchain and likely expanded functionality
Overall, this results in a three-tier model:
- A stable core cluster forming the technical baseline
- An early feature branch with minimal extension
- A later modernization branch with a changed toolchain and build environment
My clustering is not driven by hash similarity alone, but only becomes reliable through the combined temporal, structural and artefact based corelation. It also provides insight into development practices, build discipline and potential role separation within the development process of the malware
Version mapping
Based on this clustering, I derived the following version mapping:
| Version | Sample (SHA256) | Compile Date | Cluster | Besonderheiten | Developer |
|---|---|---|---|---|---|
| v0.9 | ddc6e6c76ac325d89799a50dffd11ec69ed3b5341740619b8e595b8068220914 | 23.09.2025 | Registry-Branch | + winreg library (Feature-Experiment) | unknown |
| v1.0 | e081bc408f73158c7338823f01455e4f5185a4365c8aad1d60d777e29166abbd | 19.10.2025 | Core | Baseline Toolchain | Bruno |
| v1.1 | e61b2ed360052a256b3c8761f09d185dad15c67595599da3e587c2c553e83108 | 16.11.2025 | Core | Parallel Build, stabiler Stack | Bruno |
| v1.1b | a2001892410e9f34ff0d02c8bc9e7c53b0bd10da58461e1e9eab26bdbf410c79 | 16.11.2025 | Core | Parallel Build (gleicher Timestamp) | Bruno |
| v2.0 | 7523e53c979692f9eecff6ec760ac3df5b47f172114286e570b6bba3b2133f58 | 05.01.2026 | Jacob-Branch | Neue Libs + neue rustc-demangle | Jacob |
At this point we already have a solid structural overview without having touched the actual code yet. This part comes next.
For the code comparison I use Ghidras Version Tracking module. The versions will be analyzed in the following pairs:
v0.9 <-> v1.0
v1.0 <-> v1.1
v1.1 <-> v2.0
So three comparisons in total which honestly is still a very manageable workload
Let’s get started 🙂
Version Tracking workflow
I won’t go into a full tutorial on how Ghidras Version Tracking works. Instead, I’ll briefly outline my simple workflow for today.
First, I set the confidence filter to:
-1.0 -> 0.950Everything above that can usually be assumed identical across samples. I select all those findings and accept them in bulk.
For the remaining findings, I set up a small quality-of-life shortcut:
SHIFT + T = Assign TagThen I filter the results by:
- Tag (ascending)
- Type (ascending)
- Status (ascending)
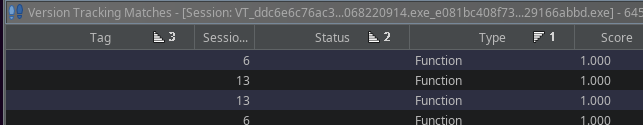
and tighten the confidence filter slightly to:
-1.0 → 0.95This gives me a clean view of all unresolved function-level differences without assigned tags, exactly the changes that matter most when identifying structural evolution.
It looks roughly like this:
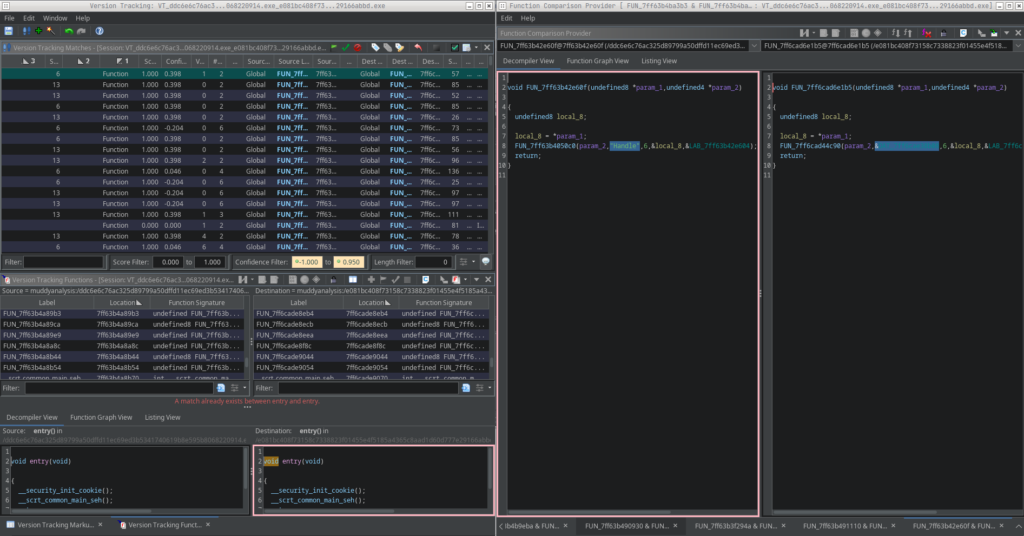
The workflow is simple:
- Select the next finding
- Open code comparison (SHIFT + C)
- If identical -> accept (SHIFT + A)
- If different -> assign a tag for later analysis (SHIFT + T)
Once accepted or tagged, the finding disappears from the filtered view and I repeat the process.
I iterate this until all relevant changes are reviewed and documented.
RustyStealer: Evolution from v0.9 to v2.0
What changed, what failed and what the developer learned
During a longitudinal analysis of multiple RustyStealer builds, four development stages become visible for me: an early baseline version (v0.9), a cleanup iteration (v1.0), a short-lived performance refactor (v1.1) and a more fundamental architectural shift in v2.0.
Rather than showing linear feature growth, the samples show a realistic iterative engineering process with experimentation, rollback and eventual consolidation toward stealth and reliability.
This analysis focuses on behavioral deltas inferred from import-level changes and binary artifacts.
Version 0.9: Early baseline and rough edges
The earliest observed build (v0.9) represents a relatively raw implementation.
Notable characteristics:
- Dependency artifacts included unused crates such as
winreg/windows-registry( i guess early experimentation or leftover scaffolding) - No meaningful behavioral differences compared to later v1.0 builds
- No advanced memory manipulation or cryptographic primitives observed
- Limited internal abstraction and minimal architectural complexity
From a development POV, v0.9 looks like a staging build that still contained residual dependencies and experimental code paths that were not yet cleaned up.
Version 1.0: Cleanup and stabilization
The transition from v0.9 to v1.0 did not introduce meaningful functional changes. The most visible difference was the removal of unused dependency artifacts (such as the winreg crate) without any observable change in imports or runtime behavior.
This looks more like a dependency cleanup rather than a behavioral refactor
Key observations:
- No changes in imported Windows APIs
- No observable change in capabilities or execution flow
- Binary differences consistent with rebuild noise and dependency graph cleanup
This phase reflects basic project hygiene rather than feature development.
Version 1.1: Performance experiment and internal refactor
Version 1.1 marks the first technically ambitious change
Major changes observed:
Introduction of asynchronous and overlapped file I/O:
- ReadFile, NtReadFile
- GetOverlappedResult, CancelIo
- Event-based synchronization (CreateEventW, WaitForMultipleObjects)
Migration to modern Windows path resolution via SHGetKnownFolderPath.
Explicit memory cleanup for shell APIs using CoTaskMemFree.
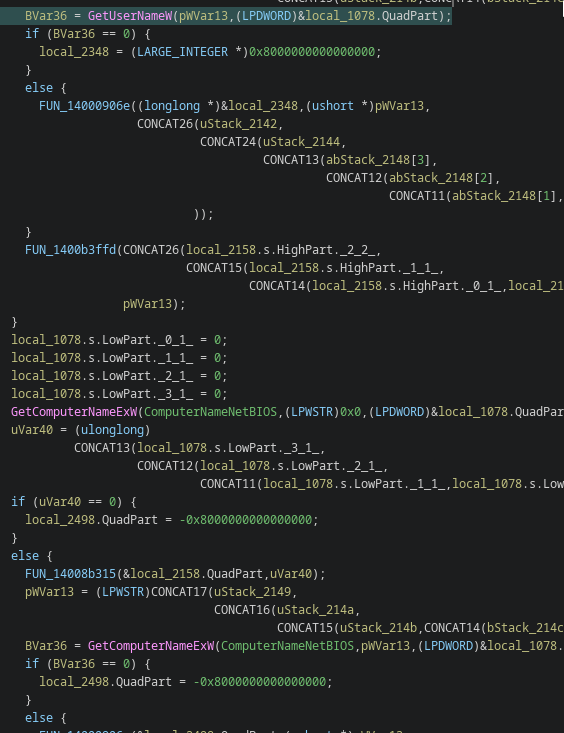
Removal of host fingerprinting:
- GetComputerNameExW
- GetUserNameW
- NetGetJoinInformation
This version appears to have attempted:
- Faster and more scalable file harvesting.
- Cleaner filesystem abstraction.
- Reduced behavioral noise by temporarily disabling host profiling.
However, asynchronous I/O pipelines significantly increase complexity and often cause instability in realworld environments
This version looks more like a technical experiment rather than a long term production design for me
Additional findings from later code diffs
Looking at later builds and comparing them back to this branch reveals several important follow-up changes that appear to originate from the 1.1 refactor.
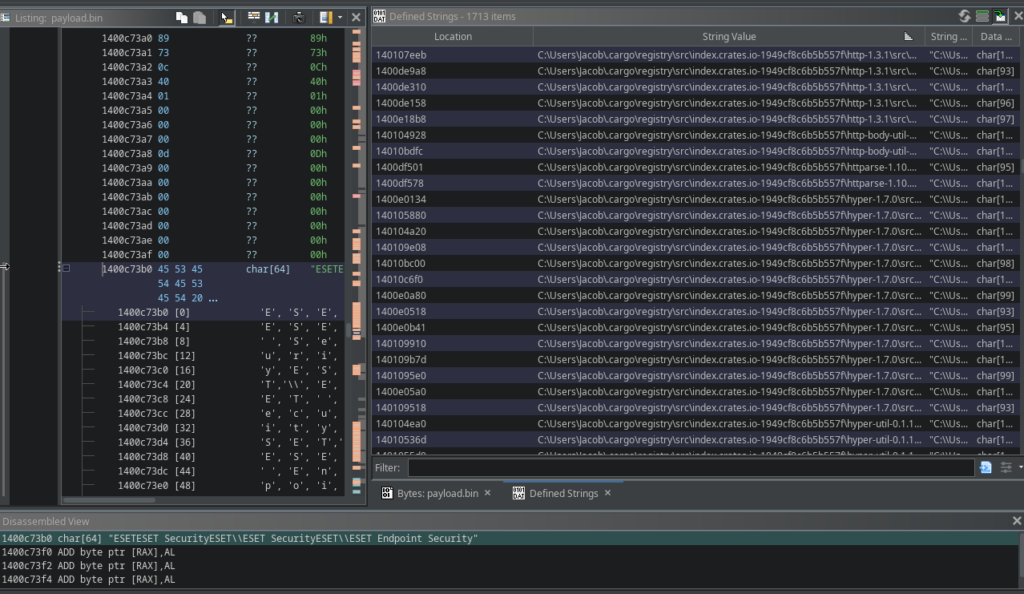
String handling and Defender artefacts
Older builds still expose cleartext strings such as direct Windows Defender directory paths, making static detection trivial.
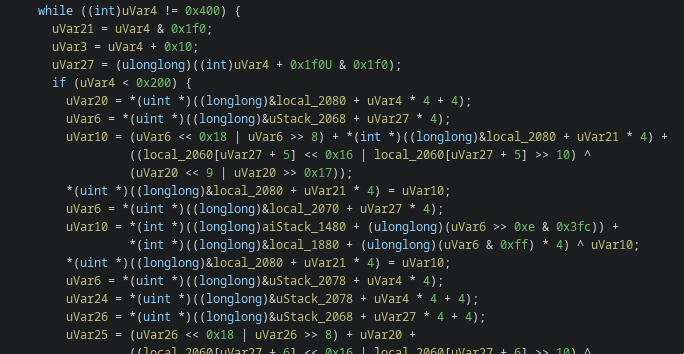
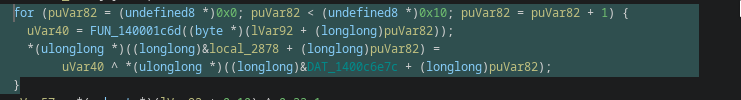
In later builds these strings disappear entirely and are reconstructed at runtime using multiple XOR-based decoding routines and different key constants.

I believe the outcome of the 1.1 refactor was the realization that static strings were becoming a liability, leading to systematic runtime string decryption in subsequent versions.
Collection handling and stability
Later builds include additional safety checks when aggregating dynamic collections (explicit overflow protection when joining result sets)
The same logic exists in earlier builds but is less defensive and less structured.
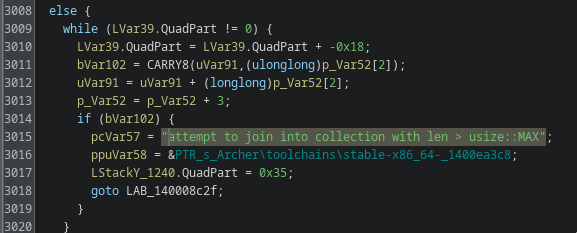
This points to stability issues encountered when processing larger data sets, which maybe were discovered during or shortly after the scalability experiments introduced in version 1.1.
Modular architecture continuity
Both older and newer builds continue to reference internal Rust modules such as:
src\modules\persist.rssrc\modules\interface.rssrc\modules\information.rssrc\modules\detect_av.rs
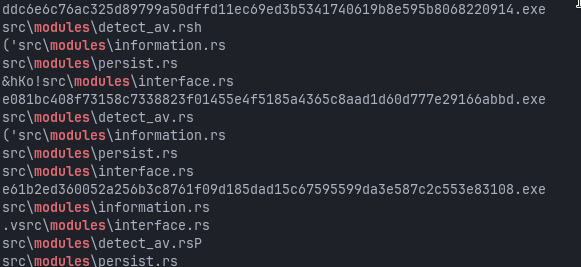
It confirms that the internal refactor in 1.1 successfully established a modular layout that later versions could iterate on without further structural changes.
Toolchain and build artefacts
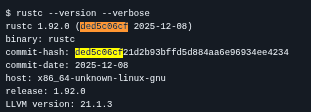
Later samples expose more Rust toolchain artefacts (stable-x86_64 paths and related metadata) and show noticeable hash divergence despite similar functionality.
This looks like a change in compiler version or build environment after this refactor phase, which may also explain subtle behavioral and binary layout differences between closely related samples.
My take
Version 1.1 looks like the point where the developers started stress testing their own architecture.
They might have pushed performance and concurrency, simplified some noisy host profiling and cleaned up API usage.
The follow-up changes visible in later diffs show that this experiment exposed two main pain points:
- Static strings and predictable artefacts were too easy to signature.
- Increased scale and concurrency exposed stability issues in collection handling.
Instead of doubling down on complex async I/O, later versions appear to focus more on obfuscation, robustness and operational reliability, while keeping the modular structure introduced here.
imo 1.1 feels less like a production release and more like a learning phase that shaped the technical direction of everything that followed.
Version 2.0: Architectural consolidation and stealth optimization
Version 2.0 represents a clear update in development priorities.
Instead of further expanding the async pipeline, the developer reverted many of the experimental components and focused on stealth, operational control and internal maturity.
Major changes observed:
Removal of asynchronous file pipeline
All overlapped I/O and event-based sync primitives present in v1.1 have been fully removed in v2.0 and later builds. No replacement async scheduling mechanisms (IOCP, APCs, worker pools or deferred execution patterns) are observable in the call graph.
The runtime execution flow is now strictly sequential, with simplified synchronization primitives replacing the earlier concurrency model.
It looks like the experimental async pipeline was abandoned in favor of a more predictable and operationally stable execution model.
It reduces architectural complexity, lowers race condition risk and improves long-term stability across victim environments.
All overlapped I/O and event-based synchronization APIs were removed, indicating that the v1.1 experiment was abandoned in favor of a simpler and more predictable execution model.
Reintroduction of host fingerprinting
Host identification APIs returned:
- GetComputerNameExW
- GetUserNameW
- NetGetJoinInformation
Focus on victim profiling, campaign correlation and backend attribution logic
The temporary removal in v1.1 now appears to have been an experimental privacy / noise reduction phase rather than a permanent design direction.
Migration towards native NT APIs
Several subsystems were migrated towards native system calls:
- Named pipes moved from CreateNamedPipeW to NtCreateNamedPipeFile
- File handling introduced NtOpenFile
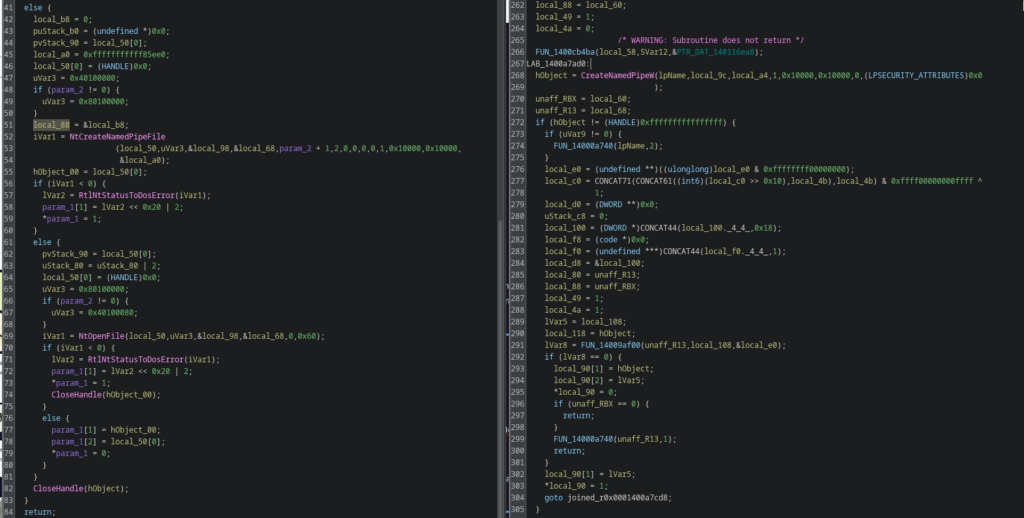
This reduces visibility to user-mode API hooking and increases resistance against common EDR userland instrumentation.
Introduction of cryptographic randomness and entropy hardening
Version 2.0 introduces a dedicated entropy generation pipeline based on SystemFunction036 (RtlGenRandom), replacing the previously implicit and largely deterministic behavior.
Rather than simply requesting random bytes, the implementation builds a full entropy pool that combines cryptographically secure randomness with adaptive jitter-based sampling and internal quality validation.
The generated entropy is statistically evaluated at runtime and rejected if it fails basic stability and distribution thresholds.
Only entropy that passes these health checks is propagated further into the execution flow.
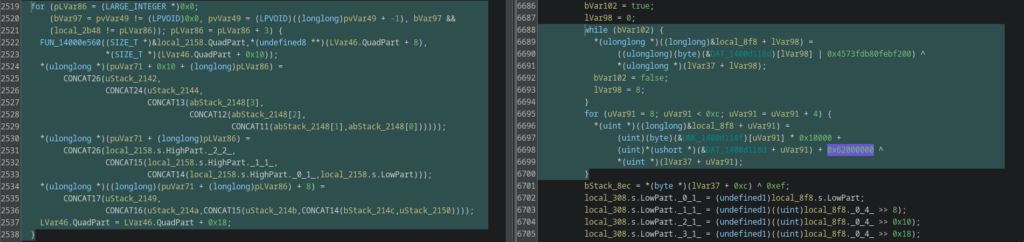
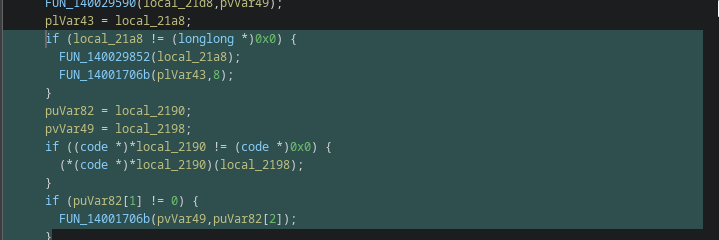
The call chain shows that the generated randomness directly feeds into subsequent runtime decoding routines, where multiple obfuscated data blocks are reconstructed through XOR-based transformations and dynamic key. In earlier versions, these decode paths relied almost entirely on static constants and predictable transformations.
In v2.0, parts of this process become entropy-dependent and therefore non-deterministic across executions
From an operational perspective this has several implications:
- Runtime decoding behavior becomes less reproducible for static analysis and sandbox instrumentation.
- Signature-based detection and clustering become more fragile, as internal state and derived values differ per execution.
- Correlation across samples using hash similarity, instruction-level signatures or deterministic unpacking pipelines becomes significantly harder.
- The malware gains a higher degree of resilience against emulation environments with weak or manipulated entropy sources.
While the mechanism could theoretically support use cases such as object naming, session identifiers or cryptographic material, the integration into the decode pipeline indicates more that the primary motivation is obfuscation hardening and stealth rather than feature expansion
It marks a shift in development priorities: the developers invest in making existing functionality harder to observe, reproduce and classify
Memory protection manipulation (VirtualProtect)
VirtualProtect appears in v2.0, but not as a generic “unpacking” indicator.
It is used to flip a read-only dispatch table to writable just long enough to store dynamically resolved API pointers, then lock it back down.
Thats consistent with the shift towards runtime API resolving and NT-level calls: fewer static imports, less signature surface and a resolver layer that is harder to tamper with or trivial hook
Internal synchronization refactor
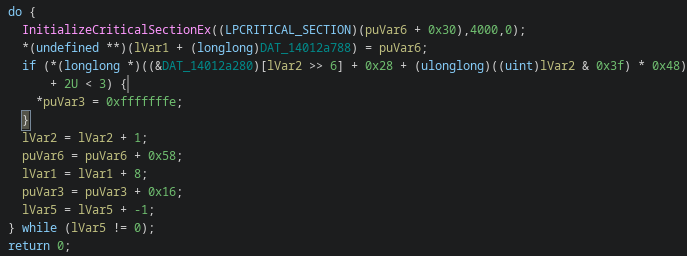
Thread state handling was refactored away from TLS primitives and migrated towards modern synchronization APIs (InitializeCriticalSectionEx)
I think it’s for architectural cleanup and improved concurrency control.
Obfuscation hardening and decoder abstraction
Compared to version 1.1, version 2.0 further abstracts string decryption and reconstruction logic.
Previously visible XOR decoders with fixed constants and static data offsets were refactored into more generic reconstruction helpers and indirect decode routines.
This significantly reduces static signature stability and increases the effort required for automated clustering and YARA-style detection.
Improved memory lifecycle management and cleanup paths
Version 2.0 introduces more explicit cleanup sequences, callback-based destructors and tighter buffer lifecycle handling.
Multiple teardown paths now explicitly free dynamically allocated buffers, invoke destructor callbacks and normalize internal state after large collection operations.
It might be an effort to reduce memory leaks, crash probability and long-running instability during high-volume data processing.
Build pipeline evolution
Build artifacts show a different Rust toolchain and build environment compared to version 1.1.
Toolchain paths shifted from shared “Archer” layouts towards user-local rustup environments, explaining observed TLSH divergence despite largely stable runtime behavior.
This reflects internal “”””build pipeline”””” changes rather than functional malware changes.
Summary
Version 2.0 prioritizes:
- Simplification and rollback of risky experimental I/O designs
- Stronger stealth via native API usage and obfuscation hardening
- Improved runtime stability and memory hygiene
- Reintroduction of host profiling for operational correlation
- Internal architectural consolidation rather than feature expansion
Overall, this release reflects a stabilization phase where operational reliability and detection resistance outweigh rapid feature development
Conclusion
If there’s one takeaway from this exercise, it’s that even relatively “boring” commodity implants become surprisingly interesting once you stop treating them as static blobs and start treating them like evolving software projects.
By correlating build artefacts, dependency drift, fuzzy hashes and targeted code diffs, we can reconstruct a fairly coherent development timeline for RustyStealer without having to reverse every single function into oblivion. We see experimentation phases (hello async pipeline), rollbacks when ideas don’t survive real-world friction, hardening towards stealth (dynamic API resolution, entropy injection) and the usual toolchain churn that comes with real developers shipping real code, even if that code happens to be malware.
None of this magically turns RustyStealer into some nextgen cyber superweapon. It’s still fundamentally a fairly standard implant doing fairly standard implant things.
Also it’s a nice reminder that “grep strings > extract a few IOCs > call it a day” only gets you so far. If you actually want to understand how an actor operates, what they experiment with and where their engineering effort goes, you have to look at trends, not snapshots.
Which admittedly takes more time, more coffee and slightly more patience than copy-pasting hashes into VirusTotal buuuut the payoff is a much clearer picture of what’s really going on under the hood.
There’s also a more general lesson in all of this imo
If the goal is to actually understand a threat actor, not just label a sample and move on, then obsessing over individual functions, opcodes and micro-optimizations only gets you part of the way.
That level of detail is useful, but it doesnt tell you how the tooling evolves, where engineering effort is invested, which ideas get abandoned or how operational priorities shift over time.
These signals live in the truly boring parts: build artefacts, dependency drift, architectural refactors, version churn and the occasional accidental breadcrumb left behind in a binary or wherever.
When you line those up over multiple samples, you start seeing intent and process instead of isolated behaviour and this exactly what we want ^-^